- Page 2:
Departament d’Ecologia Facultat d
- Page 6:
Als rius
- Page 10 and 11:
Agraïments Ara que miro enrera, me
- Page 12:
Als companys del GUADALMED per have
- Page 15:
Chapter 6 ─ Trichoptera (insecta)
- Page 19 and 20:
Resum Hi ha cinc regions en el món
- Page 21 and 22:
Resum Factors històrics Factors ec
- Page 23 and 24:
Resum METODOLOGIA CAPÍTOL 1: Un pr
- Page 25 and 26:
Resum Capítol 1. De manera general
- Page 27 and 28:
Resum conca Mediterrània (65% de s
- Page 29 and 30:
Resum importants al sud-oest austra
- Page 31 and 32:
Resum Els resultats mostraren que l
- Page 33 and 34:
Resum No s’han trobat diferèncie
- Page 35 and 36:
Resum OBJECTIUS Capítol 6 Presenta
- Page 37 and 38:
Resum comunitats de tricòpters tro
- Page 39 and 40:
Resum elevades salinitats (probable
- Page 41 and 42:
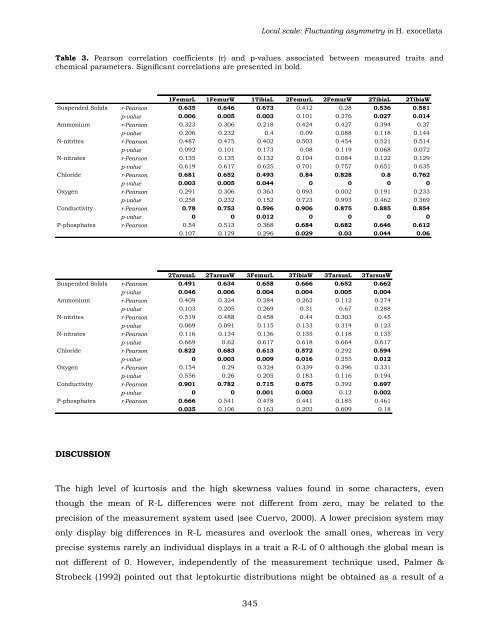
Resum d’asimetria fluctuant i, pe
- Page 43 and 44:
Brief introduction and objectives T
- Page 45 and 46:
Brief introduction and objectives H
- Page 47 and 48:
Brief introduction and objectives 3
- Page 49 and 50:
Chapter 1 (Karr, 1981, 1996) using
- Page 51 and 52:
Chapter 1 Figure 1. Segura basin an
- Page 53 and 54:
Chapter 1 PROTOCOL 2: The samples c
- Page 55 and 56:
Chapter 1 Macroinvertebrates: effec
- Page 57 and 58:
Chapter 1 % similarity Figure 4. De
- Page 59 and 60:
Chapter 1 number of taxa ISASPT 28
- Page 61 and 62:
Chapter 1 are some differences in t
- Page 63 and 64:
Chapter 1 results got in the field
- Page 65 and 66:
Chapter 1 The more appropriate taxo
- Page 67 and 68:
Chapter 1 Protocol 1. Non-reference
- Page 69 and 70:
Chapter 1 CORKUM, L. D. (1989). Pat
- Page 71 and 72:
Chapter 1 RESH , V. H.; NORRIS, R.
- Page 73 and 74:
Chapter 1 Annex 1. List of taxa fou
- Page 75 and 76:
Chapter 2 The organisms more used t
- Page 77 and 78:
Chapter 2 Palmiet basins were selec
- Page 79 and 80:
Chapter 2 calcareous and sedimentar
- Page 81 and 82:
Chapter 2 Similarities and differen
- Page 83 and 84:
Chapter 2 1 0 -1 Spain B24-RLB24-SV
- Page 85 and 86:
Chapter 2 200 160 120 80 40 0 40 30
- Page 87 and 88:
Chapter 2 macroinvertebrate fauna o
- Page 89 and 90:
Chapter 2 methodology yield better
- Page 91 and 92:
Chapter 2 VIDAL-ABARCA, M.R.; VIVAS
- Page 93 and 94:
Chapter 2 NORRIS, R. H. & GEOREGES,
- Page 95 and 96:
Chapter 2 82
- Page 97 and 98:
Chapter 3 whereas summers are hot w
- Page 99 and 100:
Chapter 3 When first explorers arri
- Page 101 and 102:
Chapter 3 stream in the most humit
- Page 103 and 104:
Chapter 3 studies at multiple scale
- Page 105 and 106:
Chapter 3 ecoregion; 4 in “Northe
- Page 107 and 108:
Chapter 3 Project was to establish
- Page 109 and 110:
Chapter 3 condition this method is
- Page 111 and 112:
Chapter 3 Table 2. Exclusive and ub
- Page 113 and 114:
Chapter 3 Chile and SAustralia have
- Page 115 and 116:
Chapter 3 Differences between all s
- Page 117 and 118:
Chapter 3 the abundants Caenidae, H
- Page 119 and 120:
Chapter 3 Mean of % relative abunda
- Page 121 and 122:
Chapter 3 For the rest of med-regio
- Page 123 and 124:
Chapter 3 The values of IV-values f
- Page 125 and 126:
Chapter 3 Temporary sites are chara
- Page 127 and 128:
Chapter 3 but not for MedBasin and
- Page 129 and 130:
Chapter 3 Table 9. IndVal results b
- Page 131 and 132:
Chapter 3 CALIFORNIA 70.8% MEDBASIN
- Page 133 and 134:
Chapter 3 Geological connexions Com
- Page 135 and 136:
Chapter 3 In spite of these observe
- Page 137 and 138:
Chapter 3 multivoltine life cycles
- Page 139 and 140:
Chapter 3 intermittency, flood freq
- Page 141 and 142:
Chapter 3 Other convergences and di
- Page 143 and 144:
Chapter 3 BALL, I. R. (1975). Natur
- Page 145 and 146:
Chapter 3 DE MOOR, F. C. (1992). a.
- Page 147 and 148:
Chapter 3 GENTILLI, J. (1989). Clim
- Page 149 and 150:
Chapter 3 LOGAN, P. & BROOKER, M. P
- Page 151 and 152:
Chapter 3 PRAT, N. 1993. El futuro
- Page 153 and 154:
Chapter 3 Minshall, G. W. (eds.). S
- Page 155 and 156:
Chapter 3 Annex 1. Presence and abs
- Page 157 and 158:
Chapter 3 California MedBasin Chile
- Page 159 and 160:
Chapter 3 Plate 1. Characteristics
- Page 161 and 162:
Chapter 3 Plate 3. Characteristics
- Page 163 and 164:
Chapter 3 Plate 5. Characteristics
- Page 165 and 166:
Chapter 4 Lake, 1992; Cooper et al.
- Page 167 and 168:
Chapter 4 Coastal Ranges SAN FRANCI
- Page 169 and 170:
Chapter 4 IndVal method (Dufrêne &
- Page 171 and 172:
Chapter 4 the bottom have a similar
- Page 173 and 174:
Chapter 4 Figure 4. Bray-Curtis clu
- Page 175 and 176:
Chapter 4 because methodologies, sa
- Page 177 and 178:
Chapter 4 mediterranean areas in th
- Page 179 and 180:
Chapter 4 DELUCCHI, C. M. (1989). M
- Page 181 and 182:
Chapter 4 168
- Page 183 and 184:
Chapter 5 distribution of organisms
- Page 185 and 186:
Chapter 5 & Allan, 1995). The level
- Page 187 and 188:
Chapter 5 samples were preserved wi
- Page 189 and 190:
Chapter 5 Data analysis Seasonal ch
- Page 191 and 192:
Chapter 5 Macroinvertebrates and te
- Page 193 and 194:
Chapter 5 As a change in the flow c
- Page 195 and 196:
Chapter 5 2 1 0 -1 -2 1 0 -1 -2 Ca
- Page 197 and 198:
Chapter 5 number of taxa 45 40 35 3
- Page 199 and 200:
Chapter 5 Results from the 4 th Cor
- Page 201 and 202:
Chapter 5 flow species”. They dis
- Page 203 and 204:
Chapter 5 As Townsend and Hildrew (
- Page 205 and 206:
Chapter 5 a mix of riffles/pool/cor
- Page 207 and 208:
Chapter 5 Although natural disturba
- Page 209 and 210:
Chapter 5 GRAY, L. J.; FISHER, S. G
- Page 211 and 212:
Chapter 5 RESH, V. H.; JACKSON, J.
- Page 213 and 214:
Chapter 5 Annex 1. Physical structu
- Page 215 and 216:
Chapter 5 Annex 3. Biological trait
- Page 217 and 218:
Chapter 5 Annex 5. Maximum affinity
- Page 219 and 220:
Chapter 6 high number of endemic sp
- Page 221 and 222:
Chapter 6 Checklist structure and t
- Page 223 and 224:
Chapter 6 This species has been rec
- Page 225 and 226:
Chapter 6 DISTRIBUTION AND ECOLOGY
- Page 227 and 228:
Chapter 6 11- Rhyacophila pascoei M
- Page 229 and 230:
Chapter 6 1984), specially to suspe
- Page 231 and 232:
Chapter 6 This species can be found
- Page 233 and 234:
Chapter 6 DISTRIBUTION AND ECOLOGY
- Page 235 and 236:
Chapter 6 DISTRIBUTION AND ECOLOGY
- Page 237 and 238:
Chapter 6 DISTRIBUTION AND ECOLOGY
- Page 239 and 240:
Chapter 6 Figure 3. Cephalic head f
- Page 241 and 242:
Chapter 6 DISTRIBUTION AND ECOLOGY
- Page 243 and 244:
Chapter 6 47- Tinodes maclachlani K
- Page 245 and 246:
Chapter 6 DISTRIBUTION AND ECOLOGY
- Page 247 and 248:
Chapter 6 DISTRIBUTION AND ECOLOGY
- Page 249 and 250:
Chapter 6 64- Drusus rectus (McLach
- Page 251 and 252:
Chapter 6 pieces of litter arranged
- Page 253 and 254:
Chapter 6 Tordera Basin: ToM6, ToM7
- Page 255 and 256:
Chapter 6 Although M. aspersus have
- Page 257 and 258:
Chapter 6 Superfamily LEPTOCEROIDEA
- Page 259 and 260:
Chapter 6 TRIBU Triaenodini Morse,
- Page 261 and 262:
Chapter 6 Schizopelex McLachlan, 18
- Page 263 and 264:
Chapter 6 present a European distri
- Page 265 and 266:
Chapter 6 REFERENCES BALLETTO, E. &
- Page 267 and 268:
Chapter 6 PRAT, N.; PUIG, M. A. & G
- Page 269 and 270:
Chapter 6 Annex 1. Sampling sites w
- Page 271 and 272:
Chapter 6 MIJARES BASIN TURIA BASIN
- Page 273 and 274:
Chapter 6 GUADALQUIVIR BASIN Site c
- Page 275 and 276:
Chapter 7 (e.g., Ormerod & Edwards,
- Page 277 and 278:
Chapter 7 Figure 1. Basins sampled
- Page 279 and 280:
Chapter 7 taken until no more famil
- Page 281 and 282:
Chapter 7 Geomorphological variable
- Page 283 and 284:
Chapter 7 Seasonal changes in caddi
- Page 285 and 286:
Chapter 7 Table 2. Maximum abundanc
- Page 287 and 288:
Chapter 7 headwaters at high altitu
- Page 289 and 290:
Chapter 7 Table 4. Pearson correlat
- Page 291 and 292:
Chapter 7 X 2 axis X 3 axis 3 2 1 0
- Page 293 and 294:
Chapter 7 280 WILK'S LAMBDA CONDUCT
- Page 295 and 296:
Chapter 7 midstreams with a mix of
- Page 297 and 298:
Chapter 7 high significant of each
- Page 299 and 300:
Chapter 7 % of total variation % of
- Page 301 and 302:
Chapter 7 Geology has been consider
- Page 303 and 304:
Chapter 7 Although the large set of
- Page 305 and 306:
Chapter 7 AUSTIN, M. P., & GREIG-SM
- Page 307 and 308: Chapter 7 RIERADEVALL, M.; SÁINZ-C
- Page 309 and 310: Chapter 7 POWER, M. E.; STOUT, R. J
- Page 311 and 312: Chapter 7 ZAMORA-MUÑOZ, C.; ALBA-T
- Page 313 and 314: Chapter 7 * Type of the riparian ha
- Page 315 and 316: Chapter 7 Annex 3. Taxa’s codes C
- Page 317 and 318: Chapter 8 & Higler, 1992). Ecologic
- Page 319 and 320: Chapter 8 Spain France Town Mountai
- Page 321 and 322: Chapter 8 depending on their degree
- Page 323 and 324: Chapter 8 Optimum and Tolerances fr
- Page 325 and 326: Chapter 8 abundance over 100 but ca
- Page 327 and 328: Chapter 8 O&T for IBMWP O&T for QBR
- Page 329 and 330: Chapter 8 O&T for SS O&T for SULPHA
- Page 331 and 332: Chapter 8 The two species of Potamo
- Page 333 and 334: Chapter 8 OXYGEN 1 0 SOLIDS OXYGEN
- Page 335 and 336: Chapter 8 OXYGEN 1 0 SOLIDS 0 P-PHO
- Page 337 and 338: Chapter 8 DISCUSSION The wide range
- Page 339 and 340: Chapter 8 incorporated, indexes at
- Page 341 and 342: Chapter 8 DOHET, A. (2002). Are cad
- Page 343 and 344: Chapter 8 SUÁR Segura. TER B 1. TO
- Page 345 and 346: Chapter 8 Annex 1. List of caddisfl
- Page 347 and 348: Chapter 8 334
- Page 349 and 350: Chapter 9 about the effect of envir
- Page 351 and 352: Chapter 9 SPAIN FRANCE Pyrenees Med
- Page 353 and 354: Chapter 9 influenced by salinity be
- Page 355 and 356: Chapter 9 depending on the trait. A
- Page 357: Chapter 9 Similarly to levels of FA
- Page 361 and 362: Chapter 9 Macroinvertebrates and Fi
- Page 363 and 364: Chapter 9 MERILÄ, J. & BJORKLUND,
- Page 365 and 366: Chapter 9 Annex 1. Values of mean (
- Page 367 and 368: Conclusions 4. Responses to tempora
- Page 369 and 370: Conclusions 356
- Page 371 and 372: Conclusions 358