

Fishery bulletin of the Fish and Wildlife Service - NOAA
Fishery bulletin of the Fish and Wildlife Service - NOAA
Fishery bulletin of the Fish and Wildlife Service - NOAA

Create successful ePaper yourself
Turn your PDF publications into a flip-book with our unique Google optimized e-Paper software.
WHITEFISH FISHERY OF LAKES HURON AND MICHIGAN 339<br />
Michigan fishermen were able to abolish <strong>the</strong> net from <strong>the</strong>ir waters by law) ; (3) <strong>the</strong><br />
summer aggregation <strong>of</strong> whitefish occurs in shallower water in Lake Michigan than in<br />
Lake Huron <strong>and</strong> hence <strong>the</strong> Lake Michigan fish never moved beyond <strong>the</strong> reach <strong>of</strong> pound<br />
nets to <strong>the</strong> same degree as did those in Lake Huron; (4) <strong>the</strong> deep-water population <strong>of</strong><br />
whitefish available to <strong>the</strong> deep trap nets was less dense in Lake Michigan than in<br />
Lake Huron, hence in contrast to <strong>the</strong> situation in Lake Huron <strong>the</strong> deep-trap-net lifts<br />
did not always average much larger than those <strong>of</strong> <strong>the</strong> pound nets. (See, for example,<br />
M-l <strong>and</strong> M-2 for 1931, table 17.)<br />
Although <strong>the</strong> deep trap net usually took more whitefish per lift than did <strong>the</strong> pound<br />
net in Lake Michigan, <strong>and</strong> from this point <strong>of</strong> view may be considered to have been very<br />
effective <strong>and</strong> successful, in no district <strong>of</strong> <strong>the</strong> lake did <strong>the</strong> catch per lift <strong>of</strong> deep trap<br />
nets approaclj <strong>the</strong> level that it attained in <strong>the</strong> four sou<strong>the</strong>rly districts <strong>of</strong> Lake<br />
Huron (tables 11 <strong>and</strong> 17). The average catch per lift <strong>of</strong> deep trap nets in Lake Michigan<br />
reached values <strong>of</strong> 257.5 pounds in M-2 in 1932 <strong>and</strong> 184.4 pounds in <strong>the</strong> same district<br />
in 1931. Operations were limited, however, in M-2. In M-l <strong>and</strong> M-3, where deeptrap-net<br />
operations were more extensive, <strong>the</strong> greatest average catches per lift were 131.7<br />
pounds (M-l in 1930) <strong>and</strong> 164.9 pounds (M-3 in 1932). These values were far below<br />
<strong>the</strong> greatest averages in <strong>the</strong> districts <strong>of</strong> central <strong>and</strong> sou<strong>the</strong>rn Lake Huron (402.5 to<br />
476.1 pounds per lift), but compared favorably with <strong>the</strong> maxima in nor<strong>the</strong>rn Lake<br />
Huron (167.7 pounds per lift in H-l in 1930; 141.9 pounds per lift in H-2 in 1930).<br />
The deep trap net was relatively unsuccessful in sou<strong>the</strong>rn Lake Michigan also, for <strong>the</strong><br />
only significant operations with <strong>the</strong> gear (M-7 in 1934) yielded an average <strong>of</strong> 118.2<br />
pounds <strong>of</strong> whitefish per lift.<br />
To be sure, <strong>the</strong> deep trap net was introduced into nor<strong>the</strong>rn Lake Michigan after<br />
<strong>the</strong> peak <strong>of</strong> abundance <strong>of</strong> <strong>the</strong> whitefish had passed. The examination <strong>of</strong> <strong>the</strong> abundance<br />
percentages <strong>of</strong> table. 21 suggests that if this gear had been fished in 1929, <strong>the</strong><br />
year <strong>of</strong> high abundance, <strong>the</strong> average catch per lift in that year most probably would<br />
have exceeded <strong>the</strong> highest yields listed in table 17 JOT deep trap nets in each <strong>of</strong> <strong>the</strong><br />
nor<strong>the</strong>rn districts. On <strong>the</strong> o<strong>the</strong>r h<strong>and</strong>, abundance percentages may not validly serve<br />
as an exact index to <strong>the</strong> average size <strong>of</strong> a lift since <strong>the</strong> fluctuations in <strong>the</strong> catch per<br />
lift <strong>of</strong> this gear did not always correspond with those in abundance subsequent to 1929.<br />
For example, <strong>the</strong> average catch per lift <strong>of</strong> deep trap nets in M-l decreased in 1931 <strong>and</strong><br />
increased in 1932 despite <strong>the</strong> fact that abundance remained practically unchanged in<br />
1931 <strong>and</strong> fell in 1932. Again, <strong>the</strong> highest yield (257.5 pounds per lift) <strong>of</strong> <strong>the</strong> nor<strong>the</strong>rn<br />
area occurred in a district (M-2) when abundance was normal (1932).<br />
As <strong>the</strong> average deep-trap-net lifts were small in comparison with those <strong>of</strong> central<br />
<strong>and</strong> sou<strong>the</strong>rn Lake Huron irrespective <strong>of</strong> how much abundance was.above average;<br />
<strong>the</strong> conclusion appears valid that in nor<strong>the</strong>rn Lake Michigan as in nor<strong>the</strong>rn Lake<br />
Huron <strong>the</strong> deep trap net was far less successful than it was in central <strong>and</strong> sou<strong>the</strong>rn<br />
Lake Huron.<br />
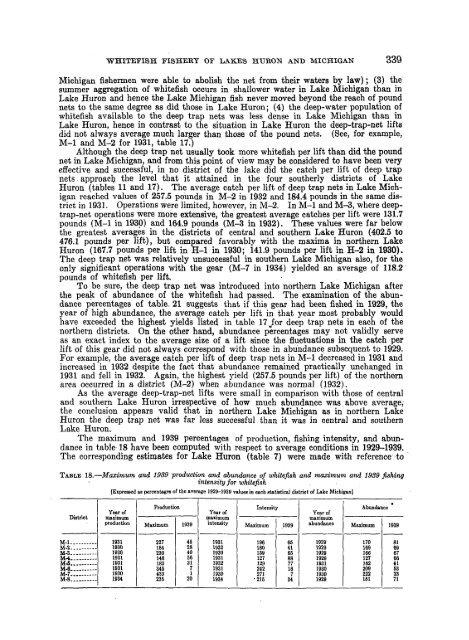
The maximum <strong>and</strong> 1939 percentages <strong>of</strong> production, fishing intensity, <strong>and</strong> abundance<br />
in table 18 have been computed with respect to average conditions in 1929-1939.<br />
The corresponding estimates for Lake Huron (table 7) were made with reference to<br />
TABLE 18.—Maximum <strong>and</strong> 1939 production <strong>and</strong> abundance <strong>of</strong> whitefish <strong>and</strong> maximum <strong>and</strong> 1939 fishing<br />
intensity for whitefish<br />
District<br />
M-l<br />
M-2<br />
M-3 - ---<br />
M-4<br />
M-ï<br />
М-в<br />
M-7<br />
M-8<br />
[Eipressed as percentages <strong>of</strong> <strong>the</strong> average 1929-1939 values in each statistical district <strong>of</strong> Lake Michigan]<br />
Year <strong>of</strong><br />
maximum<br />
production<br />
1931<br />
1930<br />
1930<br />
1931<br />
1931<br />
1931<br />
1930<br />
1934<br />
Production<br />
Maximum<br />
227<br />
184<br />
230<br />
148<br />
183<br />
345<br />
433<br />
235<br />
1939<br />
45<br />
28<br />
40<br />
58<br />
31 71<br />
20<br />
Year <strong>of</strong><br />
maximum<br />
intensity<br />
1931<br />
1932<br />
1930<br />
1931<br />
1932<br />
1931<br />
1930<br />
1934<br />
Intensity<br />
Maximum<br />
198<br />
180<br />
159<br />
127<br />
129<br />
242<br />
271<br />
•218<br />
1939<br />
85<br />
41<br />
65<br />
88<br />
77<br />
187<br />
34<br />
Year <strong>of</strong><br />
maximum<br />
abundance<br />
1929<br />
1929<br />
1929<br />
1929<br />
1931<br />
1930<br />
1930<br />
1929<br />
Abundance<br />
Maximum<br />
170<br />
189<br />
166<br />
127<br />
162<br />
209<br />
222<br />
161<br />
1939<br />
81<br />
89<br />
67<br />
88<br />
41<br />
53<br />
33<br />
71


