- Page 1 and 2:
January 2012 Volume 15 Number 1
- Page 3 and 4:
Supporting Organizations Centre for
- Page 5 and 6:
Analyzing the Learning Process of a
- Page 7 and 8:
Angeli, C., & Valanides, N. (2012).
- Page 9 and 10:
ased on an integration and evaluati
- Page 11 and 12:
ased on the assumption that no sing
- Page 13 and 14:
Diagram type D thinking (shown in F
- Page 15 and 16:
collaborative task in terms of inte
- Page 17 and 18:
Table 4. Descriptive statistics for
- Page 19 and 20:
Hong, N. S., Jonassen, D. H., & McG
- Page 21 and 22:
commercial off-the-shelf digital ga
- Page 23 and 24:
The post-questionnaire was used aft
- Page 25 and 26:
Phase Table 1. Phases and activitie
- Page 27 and 28:
Research results Describing student
- Page 29 and 30:
Assessment results for each one of
- Page 31 and 32:
References Annetta, L.A., Minogue,
- Page 33 and 34:
Huang, T.-W. (2012). Aberrance Dete
- Page 35 and 36:
Detection power Typically, the rela
- Page 37 and 38:
Results Detection rates As seen in
- Page 39 and 40:
2 .00 .05 3 .02 .10 1 .60 .40 ECI 4
- Page 41 and 42:
their easily understandable devices
- Page 43 and 44:
Ifenthaler, D. (2012). Determining
- Page 45 and 46:
activities is assumed to be reflect
- Page 47 and 48:
that the problem representations (i
- Page 49 and 50:
deductive reasoning inventory (33 m
- Page 51 and 52:
HIMATT structural measures The part
- Page 53 and 54:
outcomes, r = .297, p < .01. Accord
- Page 55 and 56:
Azevedo, R. (2009). Theoretical, co
- Page 57 and 58:
Seel, N. M. (1999b). Educational se
- Page 59 and 60:
Initially this paper explores defin
- Page 61 and 62:
gamers were boys, and 35% were girl
- Page 63 and 64:
Teachers underwent eight hours of p
- Page 65 and 66:
A correlation analysis was used to
- Page 67 and 68:
playing the game. This would mean P
- Page 69 and 70:
Yu, F. Y. (2012). Any Effects of Di
- Page 71 and 72:
Considering that identity concealme
- Page 73 and 74:
In the nickname group, the student
- Page 75 and 76:
Attitudes toward assessors Percepti
- Page 77 and 78:
Liu, Z. F., Chiu, C. H., Lin, S. S.
- Page 79 and 80:
Appendix A: Attitudes toward Peer-A
- Page 81 and 82:
Appendix C: Perception toward the I
- Page 83 and 84:
Han, H., & Johnson, S. D. (2012). R
- Page 85 and 86:
Research participants The target po
- Page 87 and 88:
that its value of cross-loading is
- Page 89 and 90:
The canonical variable for the emot
- Page 91 and 92:
Literature in the field of online l
- Page 93 and 94:
Cornelius, R. R. (1996). The scienc
- Page 95 and 96:
Shih, W.-C., Tseng, S.-S., Yang, C.
- Page 97 and 98:
To provide personalized (e-)learnin
- Page 99 and 100:
Figure 3. An illustrative example o
- Page 101 and 102:
elementary schools. Thus they are b
- Page 103 and 104:
Table 5. Descriptive statistics for
- Page 105 and 106:
References Abowd, G. D., & Atkeson,
- Page 107 and 108:
Tseng, K.-H., Chang, C.-C., Lou, S.
- Page 109 and 110:
Figure 1. The five stages of KT (Gi
- Page 111 and 112:
The use of learning strategies, mon
- Page 113 and 114:
Additionally, the above two scales
- Page 115 and 116:
Figure 3. Canonical structure betwe
- Page 117 and 118:
highly positive perception of CM an
- Page 119 and 120:
Langan-Fox, J., Platania-Phung, C.,
- Page 121 and 122:
Gömleksiz, M. N. (2012). Elementar
- Page 123 and 124:
any statistically significant diffe
- Page 125 and 126:
consideration in an educational set
- Page 127 and 128:
conditions of a learning environmen
- Page 129 and 130:
Kahle, J. B. (1983). The disadvanta
- Page 131 and 132:
Appendix A Science and Technology S
- Page 133 and 134:
(Guuawardena, Nola, Wilson, Lopez-I
- Page 135 and 136:
Questionnaire on student satisfacti
- Page 137 and 138:
G4 53 (12.5) 48.9 (13.4) 0.39 G5 51
- Page 139 and 140:
across the five levels of knowledge
- Page 141 and 142:
Santhanam, R., Sasidharan, S., Webs
- Page 143 and 144:
This paper reports only the early e
- Page 145 and 146:
Figure 1 illustrates how the abovem
- Page 147 and 148:
teacher/instructor continues to dom
- Page 149 and 150:
The instructor plays a significant
- Page 151 and 152:
Data collection and data sources Fi
- Page 153 and 154:
y turning over the responsibility t
- Page 155 and 156:
Brophy, J. (1999). Toward a model o
- Page 157 and 158:
Lawanto, O., Santoso, H. B., & Liu,
- Page 159 and 160:
such as grades and evaluation by ot
- Page 161 and 162:
students’ interest, expectancy fo
- Page 163 and 164:
constructs that measure students’
- Page 165 and 166:
Bandura, A. (1978). Reflections on
- Page 167 and 168:
Lin, J. M.-C., & Liu, S.-F. (2012).
- Page 169 and 170:
Table 1. The MSWLogo commands learn
- Page 171 and 172:
other words, we had prepared a set
- Page 173 and 174:
lab. When she returned and found th
- Page 175 and 176:
Attitudes toward Programming and Co
- Page 177 and 178:
Table 5 successfully, it took four
- Page 179 and 180:
Kuter, S., Altinay Gazi, Z., & Alti
- Page 181 and 182:
not only the means for trainees’
- Page 183 and 184:
Data Collection Techniques and Anal
- Page 185 and 186:
organizations was highlighted by on
- Page 187 and 188:
provides the means for professional
- Page 189 and 190:
Kohonen, V. (2001). Towards experie
- Page 191 and 192:
As Rogers (1995) postulates in his
- Page 193 and 194:
Instrument and data collection Afte
- Page 195 and 196:
“Raising our computer skills in C
- Page 197 and 198:
teachers deploy ICT tools in langua
- Page 199 and 200:
Ma, W., Anderson, R., & Streith, K.
- Page 201 and 202:
APPENDIX A. Questionnaire for Dista
- Page 203 and 204:
consistency with other ideas, and a
- Page 205 and 206:
conceptions, justifying their belie
- Page 207 and 208:
each group. The experimental group
- Page 209 and 210:
specifically, instructional approac
- Page 211 and 212:
Table 3 shows that the mean frequen
- Page 213 and 214:
previous Web-based instructional le
- Page 215 and 216:
Millar, R., & Osborne, J.F. (1998).
- Page 217 and 218:
Several studies explore the roles t
- Page 219 and 220:
understand the content structures o
- Page 221 and 222:
teacher was not allowed to provide
- Page 223 and 224:
two coding schemes, as illustrated
- Page 225 and 226:
also very limited. Teachers and sof
- Page 227 and 228:
learning activities. British Journa
- Page 229 and 230:
2009; Bernard & Cathryn, 2006) or p
- Page 231 and 232:
In this study, the focus of the ins
- Page 233 and 234:
The student’s degree of mastery i
- Page 235 and 236:
The questionnaire for the acceptanc
- Page 237 and 238:
the t-test result, it is found that
- Page 239 and 240:
Scale Questionnaire item Mean S.D.
- Page 241 and 242:
Hwang, G. J. (2003). A conceptual m
- Page 243 and 244:
sharing, problem solving, and achie
- Page 245 and 246:
Virtual learning environment In the
- Page 247 and 248: Class Table 1. The survey questions
- Page 249 and 250: “…the distance and the lack of
- Page 251 and 252: collaboration within EVS, thus prev
- Page 253 and 254: Huang, T.-H., Liu, Y.-C., & Chang,
- Page 255 and 256: y personalised context examples in
- Page 257 and 258: Students’ Problem-Solving Guidanc
- Page 259 and 260: Research Method Figure 8. The scree
- Page 261 and 262: Table 4. Abstract of Pairwise Compa
- Page 263 and 264: questions designed for the system h
- Page 265 and 266: Lee, J. (2012). Patterns of Interac
- Page 267 and 268: This study focused on online fora i
- Page 269 and 270: Results and Discussion Due date-cen
- Page 271 and 272: In addition, all groups developed 8
- Page 273 and 274: future. Therefore, they had an oppo
- Page 275 and 276: surprising that most interaction wa
- Page 277 and 278: Pawan, F., Paulus, T. M., Yalcin, S
- Page 279 and 280: systems by using 18 personalization
- Page 281 and 282: Short-Term Sensory Memory is a temp
- Page 283 and 284: with respect to articles by using a
- Page 285 and 286: system also computes a review value
- Page 287 and 288: DFL. d ( yi ) is the degree of mem
- Page 289 and 290: the experimental group can understa
- Page 291 and 292: Finally, Figure 10(A) and Figure 10
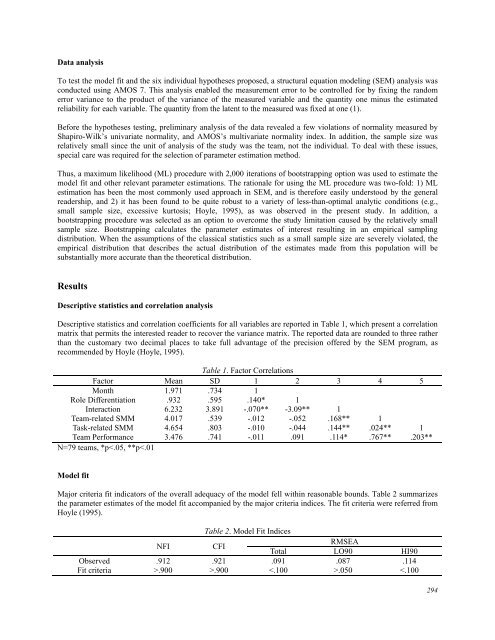
- Page 293 and 294: Appendix # Question Description Par
- Page 295 and 296: mental models, are cognitive struct
- Page 297: Based on the theoretical implicatio
- Page 301 and 302: may be considered an effective inte
- Page 303 and 304: Hsu, I.-C. (2012). Intelligent Disc
- Page 305 and 306: (Gradinarova, Zhelezov et al. 2006)
- Page 307 and 308: RLO denotes a remote learning objec
- Page 309 and 310: Figure 2. The flow-oriented LOFinde
- Page 311 and 312: if x include with y, and y include
- Page 313 and 314: Similarly, the relation metadata of
- Page 315 and 316: (defrule student-advisor (triple (p
- Page 317 and 318: References ADL. (2006). Sharable Co
- Page 319 and 320: determinants of how people think, b
- Page 321 and 322: Mediating effect of learning flow A
- Page 323 and 324: The instrument used to measure lear
- Page 325 and 326: addition, the cross-loadings of the
- Page 327 and 328: and ease of use had significant eff
- Page 329 and 330: Connell, J. P., Spencer, M. B., & A
- Page 331 and 332: Despotović-Zrakić, M., Marković,
- Page 333 and 334: Learning is a cognitive activity th
- Page 335 and 336: The survey consisted of 30 question
- Page 337 and 338: Created data mining model needs to
- Page 339 and 340: dealt with the matter taught at the
- Page 341 and 342: Conclusion Conducted research showe
- Page 343 and 344: Romero, C., Ventura S., García E.,
- Page 345 and 346: prompts as scaffolding strategy to
- Page 347 and 348: Reflection Types This study attempt
- Page 349 and 350:
All the three groups completed the
- Page 351 and 352:
Results Learning Outcomes Pre- and
- Page 353 and 354:
Map Analysis in Transfer Test Figur
- Page 355 and 356:
Generic Prompts and Specific Prompt
- Page 357 and 358:
Biswas, G., Schwartz, D., Bransford
- Page 359 and 360:
Chen, Y.-H., Looi, C.-K., Lin, C.-P
- Page 361 and 362:
of correct response, answer until c
- Page 363 and 364:
Figure 7 shows a screenshot of one
- Page 365 and 366:
Collaboration Questionnaire results
- Page 367 and 368:
following diagrams. The double-arro
- Page 369 and 370:
“Most students were encouraged to
- Page 371 and 372:
Bangert-Drowns, R.L., Kulick, C. C.
- Page 373 and 374:
primary research questions. First,
- Page 375 and 376:
Individual learning Figure 2. Scree
- Page 377 and 378:
Experimental Tools This study emplo
- Page 379 and 380:
Table 3 shows that almost all items
- Page 381 and 382:
I usually engaged myself in listeni
- Page 383 and 384:
References Bloom, B. S. (Ed.). (195
- Page 385 and 386:
APPENDIX 2. Taxonomy for Informatio
- Page 387 and 388:
understand how we can effectively u
- Page 389 and 390:
5. Is there a relationship between
- Page 391 and 392:
correlation between teachers’ IWB
- Page 393 and 394:
Q7. IWB provides advantages to me t
- Page 395 and 396:
training regarding this topic. This
- Page 397 and 398:
Conclusion This study provides a so
- Page 399:
Smith, H. J., Higgins, S., Wall, K.