User Guide for the TIMSS International Database.pdf - TIMSS and ...
User Guide for the TIMSS International Database.pdf - TIMSS and ...
User Guide for the TIMSS International Database.pdf - TIMSS and ...
Create successful ePaper yourself
Turn your PDF publications into a flip-book with our unique Google optimized e-Paper software.
S C A L I N G C H A P T E R 5<br />
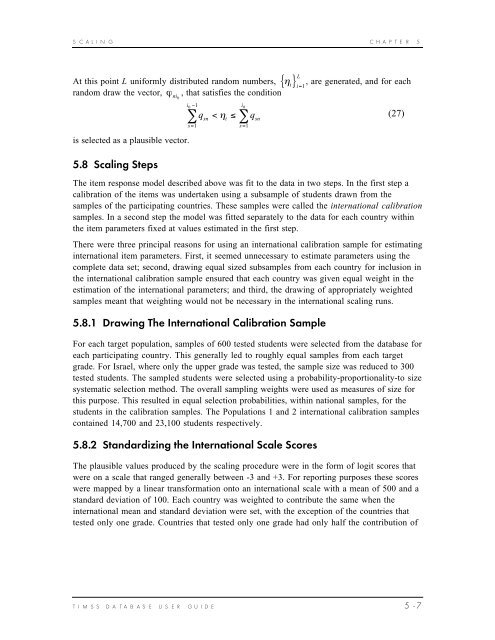
At this point L uni<strong>for</strong>mly distributed r<strong>and</strong>om numbers, hi i<br />
r<strong>and</strong>om draw <strong>the</strong> vector, j , that satisfies <strong>the</strong> condition<br />
ni0<br />
is selected as a plausible vector.<br />
5.8 Scaling Steps<br />
i0<br />
-1<br />
åqsn i0<br />
< h i £ åqsn<br />
s=<br />
1<br />
s=<br />
1<br />
L<br />
{ } , are generated, <strong>and</strong> <strong>for</strong> each<br />
=1<br />
The item response model described above was fit to <strong>the</strong> data in two steps. In <strong>the</strong> first step a<br />
calibration of <strong>the</strong> items was undertaken using a subsample of students drawn from <strong>the</strong><br />
samples of <strong>the</strong> participating countries. These samples were called <strong>the</strong> international calibration<br />
samples. In a second step <strong>the</strong> model was fitted separately to <strong>the</strong> data <strong>for</strong> each country within<br />
<strong>the</strong> item parameters fixed at values estimated in <strong>the</strong> first step.<br />
There were three principal reasons <strong>for</strong> using an international calibration sample <strong>for</strong> estimating<br />
international item parameters. First, it seemed unnecessary to estimate parameters using <strong>the</strong><br />
complete data set; second, drawing equal sized subsamples from each country <strong>for</strong> inclusion in<br />
<strong>the</strong> international calibration sample ensured that each country was given equal weight in <strong>the</strong><br />
estimation of <strong>the</strong> international parameters; <strong>and</strong> third, <strong>the</strong> drawing of appropriately weighted<br />
samples meant that weighting would not be necessary in <strong>the</strong> international scaling runs.<br />
5.8.1 Drawing The <strong>International</strong> Calibration Sample<br />
For each target population, samples of 600 tested students were selected from <strong>the</strong> database <strong>for</strong><br />
each participating country. This generally led to roughly equal samples from each target<br />
grade. For Israel, where only <strong>the</strong> upper grade was tested, <strong>the</strong> sample size was reduced to 300<br />
tested students. The sampled students were selected using a probability-proportionality-to size<br />
systematic selection method. The overall sampling weights were used as measures of size <strong>for</strong><br />
this purpose. This resulted in equal selection probabilities, within national samples, <strong>for</strong> <strong>the</strong><br />
students in <strong>the</strong> calibration samples. The Populations 1 <strong>and</strong> 2 international calibration samples<br />
contained 14,700 <strong>and</strong> 23,100 students respectively.<br />
5.8.2 St<strong>and</strong>ardizing <strong>the</strong> <strong>International</strong> Scale Scores<br />
The plausible values produced by <strong>the</strong> scaling procedure were in <strong>the</strong> <strong>for</strong>m of logit scores that<br />
were on a scale that ranged generally between -3 <strong>and</strong> +3. For reporting purposes <strong>the</strong>se scores<br />
were mapped by a linear trans<strong>for</strong>mation onto an international scale with a mean of 500 <strong>and</strong> a<br />
st<strong>and</strong>ard deviation of 100. Each country was weighted to contribute <strong>the</strong> same when <strong>the</strong><br />
international mean <strong>and</strong> st<strong>and</strong>ard deviation were set, with <strong>the</strong> exception of <strong>the</strong> countries that<br />
tested only one grade. Countries that tested only one grade had only half <strong>the</strong> contribution of<br />
T I M S S D A T A B A S E U S E R G U I D E 5 - 7<br />
(27)


