- Page 1 and 2: 内 容 简 介 本书由纸质媒
- Page 3 and 4: 环境下的 MATLAB3.0 经汉化而
- Page 5 and 6: 数值计算基础软件库变化,
- Page 7 and 8: 材或自学用书,又能当作实
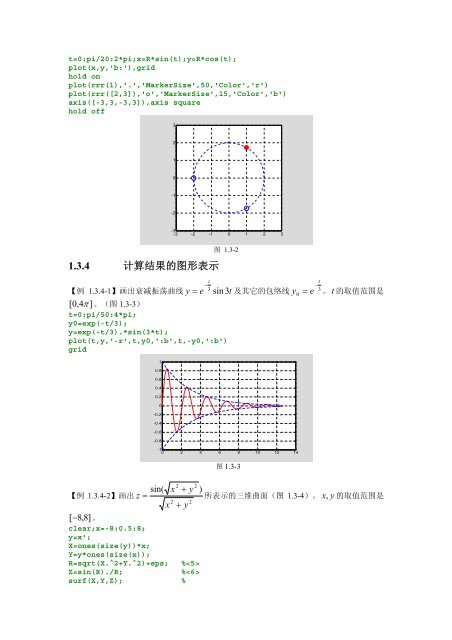
- Page 9 and 10: 第一章 基础准备及入门 本
- Page 11: ⎡1 【例 1.3.2-2】简单矩阵
- Page 15 and 16: 1.5.2 历史指令行的再运行
- Page 17 and 18: 1.7.1 Workspace Browser 工作空
- Page 19 and 20: 一 存取数据文件的指令操
- Page 21 and 22: 一 “纯文本”帮助 【例 1.
- Page 23 and 24: 三 Search 搜索窗 图 1.10-2 【
- Page 25 and 26: and('state',0) x=rand(1,5) x = 0.95
- Page 27 and 28: 上进行)。 (1) Num=[1,0,0,0,1;0,
- Page 29 and 30: P=poly(R) PR=real(P) PPR=poly2str(P
- Page 31 and 32: 2.9.2 数组操作函数 【例 2.9
- Page 33 and 34: AB_r = 1 4 7 0 0 222 2 5 8 0 0 222
- Page 35 and 36: 2.11.1 高维数组的创建 【例
- Page 37 and 38: ans(:,:,3) = 14 16 18 13 15 17 flip
- Page 39 and 40: A_1 = 1 7 13 2 8 14 size(B) ans = 2
- Page 41 and 42: (3) b_c1=b.*c b_c2=b'*c b_c3=b*c' b
- Page 43 and 44: L4 = 0 0 1 1 0 0 0 【例 2.13.2-2
- Page 45 and 46: a_s 1x2 16 double array ans 1x4 8 c
- Page 47 and 48: 3.1.3.3 转换函数产生数码字
- Page 49 and 50: 0.9501 0.4860 0.2311 0 0.6068 0 3.1
- Page 51 and 52: f2=R_A_C{1,3} class(f2) f2 = sin(-3
- Page 53 and 54: ans = 31.2000 30.4000 31.6000 28.70
- Page 55 and 56: poly2str(FC{1},'s') FC = [1x4 doubl
- Page 57 and 58: 1x5 struct array with fields: f % d
- Page 59 and 60: [1x1 struct] [] [1x1 struct] [1x5 d
- Page 61 and 62: 4.2.1 LU 分解、行列式和逆 4
- Page 63 and 64:
T_full = 0.2200 T_part = 3.1300 d =
- Page 65 and 66:
【例 4.3.4-3】sin 的数组运
- Page 67 and 68:
Dx = 3 3 3 3 3 3 Dx_2 = 1 1 1 1 1 1
- Page 69 and 70:
[tt,yy]=ginput(5);zoom off tt tt =
- Page 71 and 72:
4.7 函数极值点 4.7.1 一元函
- Page 73 and 74:
g = sum(W.*feval(fun,t))*(b-a)/2;
- Page 75 and 76:
In D:\MATLAB6p5\work\double_int.m a
- Page 77 and 78:
set(gca,'Xtick',[0,3,11,14]),grid
- Page 79 and 80:
4.9.3.1 泊松分布(Poisson distri
- Page 81 and 82:
chi2(n)=sum((y-ye).^2)/dy/dy; end Q
- Page 83 and 84:
16 14 12 10 8 6 4 2 y=3*exp(-0.4*x)
- Page 85 and 86:
4.11.1 一维插值 【例 4.11.1-1
- Page 87 and 88:
1 0.9 0.8 0.7 0.6 0.5 0.4 0.3 0.2 0
- Page 89 and 90:
(1) [fzzysym.m] function [A_sym,B_s
- Page 91 and 92:
图 4.13-1 【例 4.13.2.3-3】运
- Page 93 and 94:
w(Tow,1)=ones(length(Tow),1); % plo
- Page 95 and 96:
otherwise error(['Unknown flag '''
- Page 97 and 98:
(1) [DYDt4.m] function varargout=DY
- Page 99 and 100:
2.5 2 1.5 1 0.5 0 -0.5 -1 -1.5 插
- Page 101 and 102:
SM2=sparse(2:n,1:n-1,ones(1,n-1),n,
- Page 103 and 104:
第五章 符号计算 符号计算
- Page 105 and 106:
Ms = [ a, b] [ c, d] (2) SizeMn=siz
- Page 107 and 108:
2 ⎡ 3 x + 3 3x ⎤ ⎢ + ⎥ 【
- Page 109 and 110:
(3) f2=subs(f,{a,x},{2,sym(pi/3)})
- Page 111 and 112:
x2 ⎡ x ⎤ 1e ⎢ ⎥ 【例 5.3.
- Page 113 and 114:
yt = (-1+exp(1-t)*t)*Heaviside(t-1)
- Page 115 and 116:
D0=subs(Delta,n,0); % D15=subs(Delt
- Page 117 and 118:
5.6.3 微分方程符号解示例
- Page 119 and 120:
2 2 6 2 4 4 2 6 x~ + y - 1/6 x~ - 1
- Page 121 and 122:
第六章 数据和函数的可视
- Page 123 and 124:
t=(0:pi/50:2*pi)';k=0.4:0.1:1;Y=cos
- Page 125 and 126:
% dx=0.5;dy=1;T=[1,0,dx;0,1,dy;0,0,
- Page 127 and 128:
y → 1.2843 1.05 1 0.95 6.2.4 图
- Page 129 and 130:
200 100 6.2.5.3 多子图 0 0 2 4 6
- Page 131 and 132:
6.3.3 透视、镂空和裁切 40 3
- Page 133 and 134:
6.4 特殊图形和高维可视化
- Page 135 and 136:
subplot(1,2,1),bar3(x',Y',1) xlabel
- Page 137 and 138:
6.4.1.5 射线图 compass 和羽毛
- Page 139 and 140:
6.4.1.8 离散杆图 stem , stem3
- Page 141 and 142:
1 0.5 0 -0.5 10 5 0 -5 -10 -10 图
- Page 143 and 144:
shading faceted,colorbar('horiz'),b
- Page 145 and 146:
图 6.4-19 % clf;v1=min(min(min(V))
- Page 147 and 148:
6.5.1 视点控制和图形的旋
- Page 149 and 150:
6.5.3 照明和材质处理 6.5.3.1
- Page 151 and 152:
图 6.5-10 【例 6.5.4.3-3】本
- Page 153 and 154:
alpha('interp') 6.6 图象 6.6.1
- Page 155 and 156:
6.6.3 8 位和 16 位图象 【例
- Page 157 and 158:
6.7.2 二维图形的交互编辑
- Page 159 and 160:
图 6.8-2 【例 6.8.2-2】使用
- Page 161 and 162:
第七章 M 文件和面向对象
- Page 163 and 164:
end; i,a(i), i = 21 ans = 10946 7.3
- Page 165 and 166:
7.4.1 M 脚本文件 7.4.2 M 函数
- Page 167 and 168:
subplot(1,3,2),exm07052_1(r1,r2,'Ma
- Page 169 and 170:
Your variables are: t theta y 【
- Page 171 and 172:
2.6279 7.7 函数句柄 7.7.1 函
- Page 173 and 174:
otherwise error('输入宗量只能
- Page 175 and 176:
7.9.2.2 调试器应用示例 图 7
- Page 177 and 178:
(7) 图 7.9-4 图 7.9-5 (9) randn('
- Page 179 and 180:
7.10 面向对象编程 7.10.1 概
- Page 181 and 182:
[m,n]=size(q); vname=inputname(1);
- Page 183 and 184:
assignin('caller',inputname(1),q1);
- Page 185 and 186:
s.name=['(' class(v) ')']; end Q=qu
- Page 187 and 188:
8.1.2 SIMULINK 入门 图 8.1.1-1
- Page 189 and 190:
8.1.3 SIMULINK 库浏览器界面 8
- Page 191 and 192:
(a)缺省状态 (7)模块名的操
- Page 193 and 194:
2 ⎧ t 0 ≤ t < T ⎪ 2 u( t) =
- Page 195 and 196:
8.3.1.1 积分模块的功用 【
- Page 197 and 198:
8.3.2 非线性系统 8.3.2.1 建
- Page 199 and 200:
(3) (4) 图 8.3.2.2-1-4 8.4 子系
- Page 201 and 202:
(3) (4) (5) (6) (7) 图 8.4.2.2-1-1
- Page 203 and 204:
【例 8.4.3.1-1】利用使能原
- Page 205 and 206:
(2) (3) (4) 图 8.4.3.4-1-1 图 8.4
- Page 207 and 208:
(2) 8.5.2 多速率离散时间系
- Page 209 and 210:
8.6 SIMULINK 的分析工具 8.6.1
- Page 211 and 212:
2.0000 -1.0000 (5) eA=eig(A)',eA1=e
- Page 213 and 214:
(6) xa=trim('exm080634_1',[-1,-2]')
- Page 215 and 216:
3 3.144 3.138 4 4.626 4.591 5 7.155
- Page 217 and 218:
8.7.3.1 代数环的形成 【例 8
- Page 219 and 220:
% % switch flag, case 0, [sys,x0,st
- Page 221 and 222:
(6) 图 8.8.3.2-5 图 8.8.3.2-6 图
- Page 223 and 224:
第九章 句柄图形 与第 6 章
- Page 225 and 226:
9.3.3 对象属性的缺省设置
- Page 227 and 228:
9.6.3 轴刻度的属性控制 9.6.
- Page 229 and 230:
line(0.24,0.23,'Marker','^','Marker
- Page 231 and 232:
light('Position',[0 -1.5 0],'color'
- Page 233 and 234:
9.7.6 surface 指令衍生不同曲
- Page 235 and 236:
Y=5*[0 0 0 0;0 1 1 0;1 1 1 1;1 0 0
- Page 237 and 238:
end (2) (3) 15
- Page 239 and 240:
图 10.1-1 (2) h_text=uicontrol(h_f
- Page 241 and 242:
10.2.1 设计原则 (1)简单性 (2
- Page 243 and 244:
图 10.3-5 (4) uimenu('Label','Test
- Page 245 and 246:
'callback',[... 'grid on,',... 'set
- Page 247 and 248:
10.3.4 现场菜单的制作 图 10
- Page 249 and 250:
图 10.4-1 10.4.3.2 静态文本框
- Page 251 and 252:
【例 10.4.3.3-1】目标:制作
- Page 253 and 254:
[calledit2.m] function calledit2( )
- Page 255 and 256:
10.6.1 界面设计工具的结构
- Page 257 and 258:
(1)步骤一: (2)步骤二: (3)步
- Page 259 and 260:
guidata(fig, handles); set(handles.
- Page 261 and 262:
第十一章 MATLAB 编译器 几
- Page 263 and 264:
图 11.2-2 11.2.3 为产生独立
- Page 265 and 266:
11.3.2 由 M 文件创建外部应
- Page 267 and 268:
mccstartup not found. exm3* not fou
- Page 269 and 270:
够识别出 nargin、nargout、for
- Page 271 and 272:
11.6.3.3 由包含绘图指令的 M
- Page 273 and 274:
disp('矩阵 A 的奇异值 = ') el
- Page 275 and 276:
1.4 1.2 1 0.8 0.6 0.4 0.2 0 -0.2 -0
- Page 277 and 278:
图 11.6-6 17
- Page 279 and 280:
12.1.3 C 语言 MEX 文件源程序
- Page 281 and 282:
* 其他 C 源码……*/ } (2) #in
- Page 283 and 284:
} input_buf0=(char *)mxCalloc(bufle
- Page 285 and 286:
mex exm120153_2.cpp (3) exm120153_2
- Page 287 and 288:
printf("Error reopening file %s\n",
- Page 289 and 290:
GlobalDouble,LocalDouble,LocalStrin
- Page 291 and 292:
#define BUFSIZE 512 int main() { En
- Page 293 and 294:
图 12.3-3 12.3.3 利用 VC++ 6.0
- Page 295 and 296:
(2) #include "engine.h" #include "m
- Page 297 and 298:
} (3) (4) (5) cout
- Page 299 and 300:
invoke(excel, 'Quit'); 图 12.4-1 1
- Page 301 and 302:
(2) 图 12.4-5 图 12.4-6 24
- Page 303 and 304:
Private Sub CommandButton1_Click( )
- Page 305 and 306:
(4) (5) Private Sub CommandButton1_
- Page 307 and 308:
(1) 图 12.5-3 图 12.5-4 30
- Page 309 and 310:
(3) (4) TextInput.LinkMode = vbLink
- Page 311 and 312:
(3) 图 12.5-11 34 图 12.5-10
- Page 313 and 314:
36 图 12.5-14
- Page 315 and 316:
13.2.1 从 Word 中启动 Notebook
- Page 317 and 318:
plot(t,y,'k','LineWidth',4) % hold
- Page 319 and 320:
13.3.3.3 整个 M-book 文件的运
- Page 321 and 322:
13.4.1 在 M-book 中实现计算
- Page 323 and 324:
(2) (3) syms t s a w ft=exp(-a*t)*s
- Page 325 and 326:
B.1 光盘文件的结构 附录 B:
- Page 327 and 328:
失彼,而造成仿真失败。本
- Page 329:
参 考 文 献 [1] M.L.Abell, J.P.