

A systematic review of the effectiveness of adalimumab
A systematic review of the effectiveness of adalimumab
A systematic review of the effectiveness of adalimumab

You also want an ePaper? Increase the reach of your titles
YUMPU automatically turns print PDFs into web optimized ePapers that Google loves.
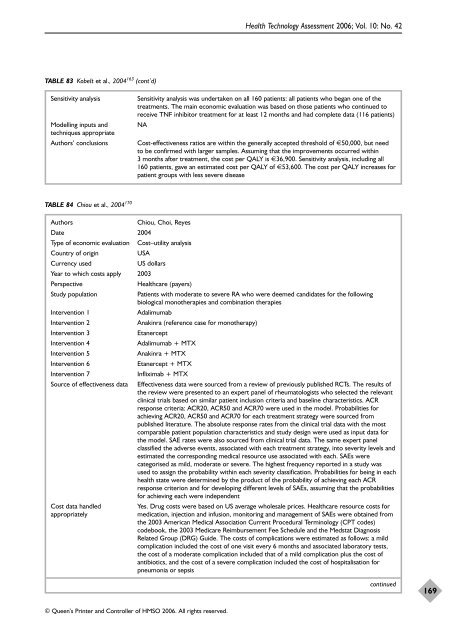
TABLE 83 Kobelt et al., 2004 163 (cont’d)<br />
© Queen’s Printer and Controller <strong>of</strong> HMSO 2006. All rights reserved.<br />
Health Technology Assessment 2006; Vol. 10: No. 42<br />
Sensitivity analysis Sensitivity analysis was undertaken on all 160 patients: all patients who began one <strong>of</strong> <strong>the</strong><br />
treatments. The main economic evaluation was based on those patients who continued to<br />
receive TNF inhibitor treatment for at least 12 months and had complete data (116 patients)<br />
Modelling inputs and NA<br />
techniques appropriate<br />
Authors’ conclusions Cost-<strong>effectiveness</strong> ratios are within <strong>the</strong> generally accepted threshold <strong>of</strong> €50,000, but need<br />
to be confirmed with larger samples. Assuming that <strong>the</strong> improvements occurred within<br />
3 months after treatment, <strong>the</strong> cost per QALY is €36,900. Sensitivity analysis, including all<br />
160 patients, gave an estimated cost per QALY <strong>of</strong> €53,600. The cost per QALY increases for<br />
patient groups with less severe disease<br />
TABLE 84 Chiou et al., 2004 170<br />
Authors Chiou, Choi, Reyes<br />
Date 2004<br />
Type <strong>of</strong> economic evaluation Cost–utility analysis<br />
Country <strong>of</strong> origin USA<br />
Currency used US dollars<br />
Year to which costs apply 2003<br />
Perspective Healthcare (payers)<br />
Study population Patients with moderate to severe RA who were deemed candidates for <strong>the</strong> following<br />
biological mono<strong>the</strong>rapies and combination <strong>the</strong>rapies<br />
Intervention 1 Adalimumab<br />
Intervention 2 Anakinra (reference case for mono<strong>the</strong>rapy)<br />
Intervention 3 Etanercept<br />
Intervention 4 Adalimumab + MTX<br />
Intervention 5 Anakinra + MTX<br />
Intervention 6 Etanercept + MTX<br />
Intervention 7 Infliximab + MTX<br />
Source <strong>of</strong> <strong>effectiveness</strong> data Effectiveness data were sourced from a <strong>review</strong> <strong>of</strong> previously published RCTs. The results <strong>of</strong><br />
<strong>the</strong> <strong>review</strong> were presented to an expert panel <strong>of</strong> rheumatologists who selected <strong>the</strong> relevant<br />
clinical trials based on similar patient inclusion criteria and baseline characteristics. ACR<br />
response criteria: ACR20, ACR50 and ACR70 were used in <strong>the</strong> model. Probabilities for<br />
achieving ACR20, ACR50 and ACR70 for each treatment strategy were sourced from<br />
published literature. The absolute response rates from <strong>the</strong> clinical trial data with <strong>the</strong> most<br />
comparable patient population characteristics and study design were used as input data for<br />
<strong>the</strong> model. SAE rates were also sourced from clinical trial data. The same expert panel<br />
classified <strong>the</strong> adverse events, associated with each treatment strategy, into severity levels and<br />
estimated <strong>the</strong> corresponding medical resource use associated with each. SAEs were<br />
categorised as mild, moderate or severe. The highest frequency reported in a study was<br />
used to assign <strong>the</strong> probability within each severity classification. Probabilities for being in each<br />
health state were determined by <strong>the</strong> product <strong>of</strong> <strong>the</strong> probability <strong>of</strong> achieving each ACR<br />
response criterion and for developing different levels <strong>of</strong> SAEs, assuming that <strong>the</strong> probabilities<br />
for achieving each were independent<br />
Cost data handled Yes. Drug costs were based on US average wholesale prices. Healthcare resource costs for<br />
appropriately medication, injection and infusion, monitoring and management <strong>of</strong> SAEs were obtained from<br />
<strong>the</strong> 2003 American Medical Association Current Procedural Terminology (CPT codes)<br />
codebook, <strong>the</strong> 2003 Medicare Reimbursement Fee Schedule and <strong>the</strong> Medstat Diagnosis<br />
Related Group (DRG) Guide. The costs <strong>of</strong> complications were estimated as follows: a mild<br />
complication included <strong>the</strong> cost <strong>of</strong> one visit every 6 months and associated laboratory tests,<br />
<strong>the</strong> cost <strong>of</strong> a moderate complication included that <strong>of</strong> a mild complication plus <strong>the</strong> cost <strong>of</strong><br />
antibiotics, and <strong>the</strong> cost <strong>of</strong> a severe complication included <strong>the</strong> cost <strong>of</strong> hospitalisation for<br />
pneumonia or sepsis<br />
continued<br />
169


