

A systematic review of the effectiveness of adalimumab
A systematic review of the effectiveness of adalimumab
A systematic review of the effectiveness of adalimumab

Create successful ePaper yourself
Turn your PDF publications into a flip-book with our unique Google optimized e-Paper software.
198<br />
Appendix 10<br />
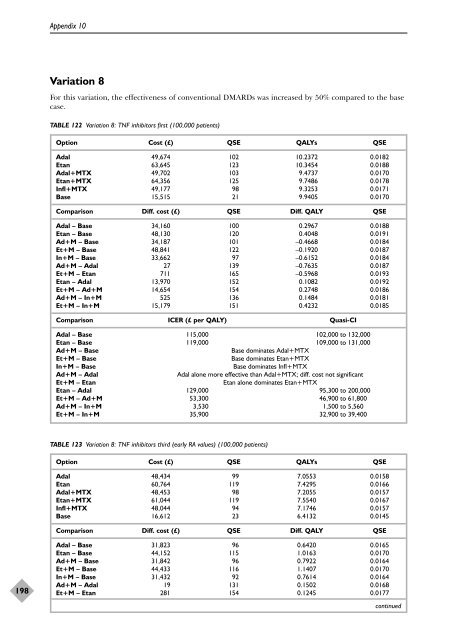
Variation 8<br />
For this variation, <strong>the</strong> <strong>effectiveness</strong> <strong>of</strong> conventional DMARDs was increased by 50% compared to <strong>the</strong> base<br />
case.<br />
TABLE 122 Variation 8: TNF inhibitors first (100,000 patients)<br />
Option Cost (£) QSE QALYs QSE<br />
Adal 49,674 102 10.2372 0.0182<br />
Etan 63,645 123 10.3454 0.0188<br />
Adal+MTX 49,702 103 9.4737 0.0170<br />
Etan+MTX 64,356 125 9.7486 0.0178<br />
Infl+MTX 49,177 98 9.3253 0.0171<br />
Base 15,515 21 9.9405 0.0170<br />
Comparison Diff. cost (£) QSE Diff. QALY QSE<br />
Adal – Base 34,160 100 0.2967 0.0188<br />
Etan – Base 48,130 120 0.4048 0.0191<br />
Ad+M – Base 34,187 101 –0.4668 0.0184<br />
Et+M – Base 48,841 122 –0.1920 0.0187<br />
In+M – Base 33,662 97 –0.6152 0.0184<br />
Ad+M – Adal 27 139 –0.7635 0.0187<br />
Et+M – Etan 711 165 –0.5968 0.0193<br />
Etan – Adal 13,970 152 0.1082 0.0192<br />
Et+M – Ad+M 14,654 154 0.2748 0.0186<br />
Ad+M – In+M 525 136 0.1484 0.0181<br />
Et+M – In+M 15,179 151 0.4232 0.0185<br />
Comparison ICER (£ per QALY) Quasi-CI<br />
Adal – Base 115,000 102,000 to 132,000<br />
Etan – Base 119,000 109,000 to 131,000<br />
Ad+M – Base Base dominates Adal+MTX<br />
Et+M – Base Base dominates Etan+MTX<br />
In+M – Base Base dominates Infl+MTX<br />
Ad+M – Adal Adal alone more effective than Adal+MTX; diff. cost not significant<br />
Et+M – Etan Etan alone dominates Etan+MTX<br />
Etan – Adal 129,000 95,300 to 200,000<br />
Et+M – Ad+M 53,300 46,900 to 61,800<br />
Ad+M – In+M 3,530 1,500 to 5,560<br />
Et+M – In+M 35,900 32,900 to 39,400<br />
TABLE 123 Variation 8: TNF inhibitors third (early RA values) (100,000 patients)<br />
Option Cost (£) QSE QALYs QSE<br />
Adal 48,434 99 7.0553 0.0158<br />
Etan 60,764 119 7.4295 0.0166<br />
Adal+MTX 48,453 98 7.2055 0.0157<br />
Etan+MTX 61,044 119 7.5540 0.0167<br />
Infl+MTX 48,044 94 7.1746 0.0157<br />
Base 16,612 23 6.4132 0.0145<br />
Comparison Diff. cost (£) QSE Diff. QALY QSE<br />
Adal – Base 31,823 96 0.6420 0.0165<br />
Etan – Base 44,152 115 1.0163 0.0170<br />
Ad+M – Base 31,842 96 0.7922 0.0164<br />
Et+M – Base 44,433 116 1.1407 0.0170<br />
In+M – Base 31,432 92 0.7614 0.0164<br />
Ad+M – Adal 19 131 0.1502 0.0168<br />
Et+M – Etan 281 154 0.1245 0.0177<br />
continued


