

A systematic review of the effectiveness of adalimumab
A systematic review of the effectiveness of adalimumab
A systematic review of the effectiveness of adalimumab

You also want an ePaper? Increase the reach of your titles
YUMPU automatically turns print PDFs into web optimized ePapers that Google loves.
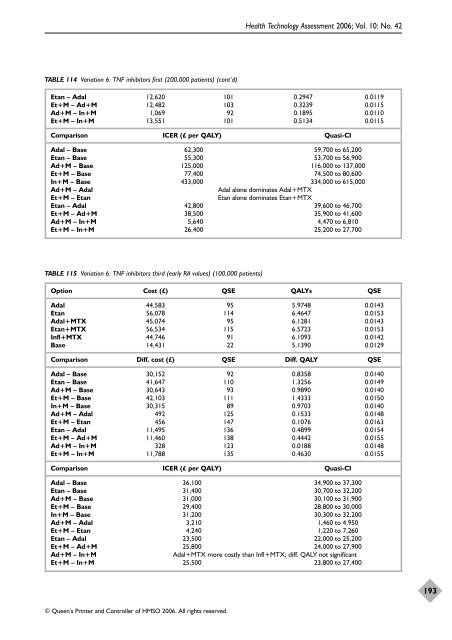
TABLE 114 Variation 6: TNF inhibitors first (200,000 patients) (cont’d)<br />
© Queen’s Printer and Controller <strong>of</strong> HMSO 2006. All rights reserved.<br />
Health Technology Assessment 2006; Vol. 10: No. 42<br />
Etan – Adal 12,620 101 0.2947 0.0119<br />
Et+M – Ad+M 12,482 103 0.3239 0.0115<br />
Ad+M – In+M 1,069 92 0.1895 0.0110<br />
Et+M – In+M 13,551 101 0.5134 0.0115<br />
Comparison ICER (£ per QALY) Quasi-CI<br />
Adal – Base 62,300 59,700 to 65,200<br />
Etan – Base 55,300 53,700 to 56,900<br />
Ad+M – Base 125,000 116,000 to 137,000<br />
Et+M – Base 77,400 74,500 to 80,600<br />
In+M – Base 433,000 334,000 to 615,000<br />
Ad+M – Adal Adal alone dominates Adal+MTX<br />
Et+M – Etan Etan alone dominates Etan+MTX<br />
Etan – Adal 42,800 39,600 to 46,700<br />
Et+M – Ad+M 38,500 35,900 to 41,600<br />
Ad+M – In+M 5,640 4,470 to 6,810<br />
Et+M – In+M 26,400 25,200 to 27,700<br />
TABLE 115 Variation 6: TNF inhibitors third (early RA values) (100,000 patients)<br />
Option Cost (£) QSE QALYs QSE<br />
Adal 44,583 95 5.9748 0.0143<br />
Etan 56,078 114 6.4647 0.0153<br />
Adal+MTX 45,074 95 6.1281 0.0143<br />
Etan+MTX 56,534 115 6.5723 0.0153<br />
Infl+MTX 44,746 91 6.1093 0.0142<br />
Base 14,431 22 5.1390 0.0129<br />
Comparison Diff. cost (£) QSE Diff. QALY QSE<br />
Adal – Base 30,152 92 0.8358 0.0140<br />
Etan – Base 41,647 110 1.3256 0.0149<br />
Ad+M – Base 30,643 93 0.9890 0.0140<br />
Et+M – Base 42,103 111 1.4333 0.0150<br />
In+M – Base 30,315 89 0.9703 0.0140<br />
Ad+M – Adal 492 125 0.1533 0.0148<br />
Et+M – Etan 456 147 0.1076 0.0163<br />
Etan – Adal 11,495 136 0.4899 0.0154<br />
Et+M – Ad+M 11,460 138 0.4442 0.0155<br />
Ad+M – In+M 328 123 0.0188 0.0148<br />
Et+M – In+M 11,788 135 0.4630 0.0155<br />
Comparison ICER (£ per QALY) Quasi-CI<br />
Adal – Base 36,100 34,900 to 37,300<br />
Etan – Base 31,400 30,700 to 32,200<br />
Ad+M – Base 31,000 30,100 to 31,900<br />
Et+M – Base 29,400 28,800 to 30,000<br />
In+M – Base 31,200 30,300 to 32,200<br />
Ad+M – Adal 3,210 1,460 to 4,950<br />
Et+M – Etan 4,240 1,220 to 7,260<br />
Etan – Adal 23,500 22,000 to 25,200<br />
Et+M – Ad+M 25,800 24,000 to 27,900<br />
Ad+M – In+M Adal+MTX more costly than Infl+MTX; diff. QALY not significant<br />
Et+M – In+M 25,500 23,800 to 27,400<br />
193


