

A systematic review of the effectiveness of adalimumab
A systematic review of the effectiveness of adalimumab
A systematic review of the effectiveness of adalimumab

Create successful ePaper yourself
Turn your PDF publications into a flip-book with our unique Google optimized e-Paper software.
200<br />
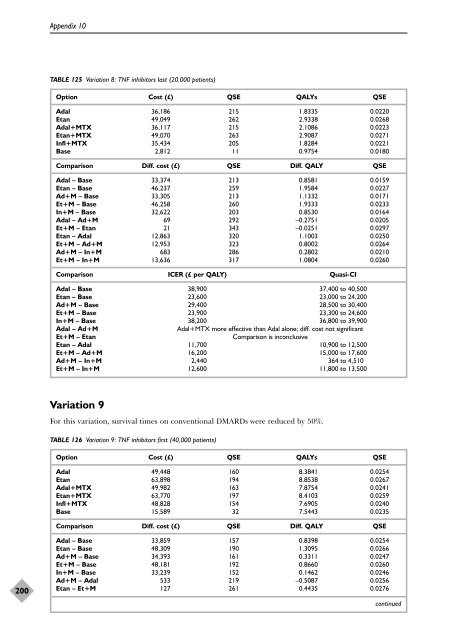
Appendix 10<br />
TABLE 125 Variation 8: TNF inhibitors last (20,000 patients)<br />
Option Cost (£) QSE QALYs QSE<br />
Adal 36,186 215 1.8335 0.0220<br />
Etan 49,049 262 2.9338 0.0268<br />
Adal+MTX 36,117 215 2.1086 0.0223<br />
Etan+MTX 49,070 263 2.9087 0.0271<br />
Infl+MTX 35,434 205 1.8284 0.0221<br />
Base 2,812 11 0.9754 0.0180<br />
Comparison Diff. cost (£) QSE Diff. QALY QSE<br />
Adal – Base 33,374 213 0.8581 0.0159<br />
Etan – Base 46,237 259 1.9584 0.0227<br />
Ad+M – Base 33,305 213 1.1332 0.0171<br />
Et+M – Base 46,258 260 1.9333 0.0233<br />
In+M – Base 32,622 203 0.8530 0.0164<br />
Adal – Ad+M 69 292 –0.2751 0.0205<br />
Et+M – Etan 21 343 –0.0251 0.0297<br />
Etan – Adal 12,863 320 1.1003 0.0250<br />
Et+M – Ad+M 12,953 323 0.8002 0.0264<br />
Ad+M – In+M 683 286 0.2802 0.0210<br />
Et+M – In+M 13,636 317 1.0804 0.0260<br />
Comparison ICER (£ per QALY) Quasi-CI<br />
Adal – Base 38,900 37,400 to 40,500<br />
Etan – Base 23,600 23,000 to 24,200<br />
Ad+M – Base 29,400 28,500 to 30,400<br />
Et+M – Base 23,900 23,300 to 24,600<br />
In+M – Base 38,200 36,800 to 39,900<br />
Adal – Ad+M Adal+MTX more effective than Adal alone; diff. cost not significant<br />
Et+M – Etan Comparison is inconclusive<br />
Etan – Adal 11,700 10,900 to 12,500<br />
Et+M – Ad+M 16,200 15,000 to 17,600<br />
Ad+M – In+M 2,440 364 to 4,510<br />
Et+M – In+M 12,600 11,800 to 13,500<br />
Variation 9<br />
For this variation, survival times on conventional DMARDs were reduced by 50%.<br />
TABLE 126 Variation 9: TNF inhibitors first (40,000 patients)<br />
Option Cost (£) QSE QALYs QSE<br />
Adal 49,448 160 8.3841 0.0254<br />
Etan 63,898 194 8.8538 0.0267<br />
Adal+MTX 49,982 163 7.8754 0.0241<br />
Etan+MTX 63,770 197 8.4103 0.0259<br />
Infl+MTX 48,828 154 7.6905 0.0240<br />
Base 15,589 32 7.5443 0.0235<br />
Comparison Diff. cost (£) QSE Diff. QALY QSE<br />
Adal – Base 33,859 157 0.8398 0.0254<br />
Etan – Base 48,309 190 1.3095 0.0266<br />
Ad+M – Base 34,393 161 0.3311 0.0247<br />
Et+M – Base 48,181 192 0.8660 0.0260<br />
In+M – Base 33,239 152 0.1462 0.0246<br />
Ad+M – Adal 533 219 –0.5087 0.0256<br />
Etan – Et+M 127 261 0.4435 0.0276<br />
continued


