

A systematic review of the effectiveness of adalimumab
A systematic review of the effectiveness of adalimumab
A systematic review of the effectiveness of adalimumab

Create successful ePaper yourself
Turn your PDF publications into a flip-book with our unique Google optimized e-Paper software.
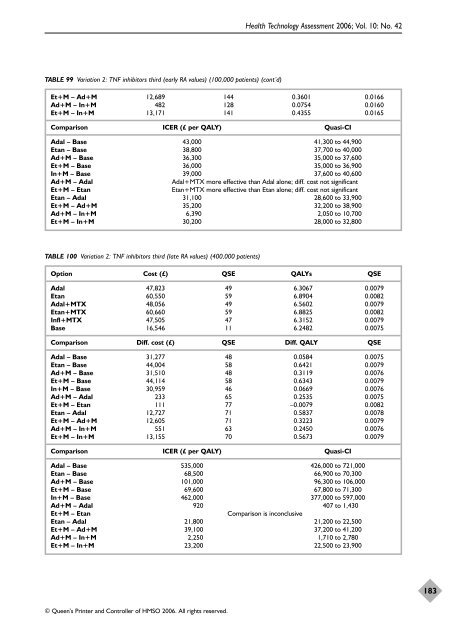
TABLE 99 Variation 2: TNF inhibitors third (early RA values) (100,000 patients) (cont’d)<br />
© Queen’s Printer and Controller <strong>of</strong> HMSO 2006. All rights reserved.<br />
Health Technology Assessment 2006; Vol. 10: No. 42<br />
Et+M – Ad+M 12,689 144 0.3601 0.0166<br />
Ad+M – In+M 482 128 0.0754 0.0160<br />
Et+M – In+M 13,171 141 0.4355 0.0165<br />
Comparison ICER (£ per QALY) Quasi-CI<br />
Adal – Base 43,000 41,300 to 44,900<br />
Etan – Base 38,800 37,700 to 40,000<br />
Ad+M – Base 36,300 35,000 to 37,600<br />
Et+M – Base 36,000 35,000 to 36,900<br />
In+M – Base 39,000 37,600 to 40,600<br />
Ad+M – Adal Adal+MTX more effective than Adal alone; diff. cost not significant<br />
Et+M – Etan Etan+MTX more effective than Etan alone; diff. cost not significant<br />
Etan – Adal 31,100 28,600 to 33,900<br />
Et+M – Ad+M 35,200 32,200 to 38,900<br />
Ad+M – In+M 6,390 2,050 to 10,700<br />
Et+M – In+M 30,200 28,000 to 32,800<br />
TABLE 100 Variation 2: TNF inhibitors third (late RA values) (400,000 patients)<br />
Option Cost (£) QSE QALYs QSE<br />
Adal 47,823 49 6.3067 0.0079<br />
Etan 60,550 59 6.8904 0.0082<br />
Adal+MTX 48,056 49 6.5602 0.0079<br />
Etan+MTX 60,660 59 6.8825 0.0082<br />
Infl+MTX 47,505 47 6.3152 0.0079<br />
Base 16,546 11 6.2482 0.0075<br />
Comparison Diff. cost (£) QSE Diff. QALY QSE<br />
Adal – Base 31,277 48 0.0584 0.0075<br />
Etan – Base 44,004 58 0.6421 0.0079<br />
Ad+M – Base 31,510 48 0.3119 0.0076<br />
Et+M – Base 44,114 58 0.6343 0.0079<br />
In+M – Base 30,959 46 0.0669 0.0076<br />
Ad+M – Adal 233 65 0.2535 0.0075<br />
Et+M – Etan 111 77 –0.0079 0.0082<br />
Etan – Adal 12,727 71 0.5837 0.0078<br />
Et+M – Ad+M 12,605 71 0.3223 0.0079<br />
Ad+M – In+M 551 63 0.2450 0.0076<br />
Et+M – In+M 13,155 70 0.5673 0.0079<br />
Comparison ICER (£ per QALY) Quasi-CI<br />
Adal – Base 535,000 426,000 to 721,000<br />
Etan – Base 68,500 66,900 to 70,300<br />
Ad+M – Base 101,000 96,300 to 106,000<br />
Et+M – Base 69,600 67,800 to 71,300<br />
In+M – Base 462,000 377,000 to 597,000<br />
Ad+M – Adal 920 407 to 1,430<br />
Et+M – Etan Comparison is inconclusive<br />
Etan – Adal 21,800 21,200 to 22,500<br />
Et+M – Ad+M 39,100 37,200 to 41,200<br />
Ad+M – In+M 2,250 1,710 to 2,780<br />
Et+M – In+M 23,200 22,500 to 23,900<br />
183


