

A systematic review of the effectiveness of adalimumab
A systematic review of the effectiveness of adalimumab
A systematic review of the effectiveness of adalimumab

Create successful ePaper yourself
Turn your PDF publications into a flip-book with our unique Google optimized e-Paper software.
212<br />
Appendix 10<br />
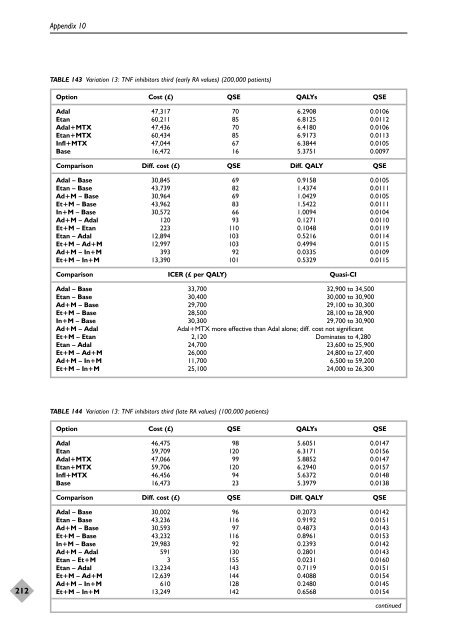
TABLE 143 Variation 13: TNF inhibitors third (early RA values) (200,000 patients)<br />
Option Cost (£) QSE QALYs QSE<br />
Adal 47,317 70 6.2908 0.0106<br />
Etan 60,211 85 6.8125 0.0112<br />
Adal+MTX 47,436 70 6.4180 0.0106<br />
Etan+MTX 60,434 85 6.9173 0.0113<br />
Infl+MTX 47,044 67 6.3844 0.0105<br />
Base 16,472 16 5.3751 0.0097<br />
Comparison Diff. cost (£) QSE Diff. QALY QSE<br />
Adal – Base 30,845 69 0.9158 0.0105<br />
Etan – Base 43,739 82 1.4374 0.0111<br />
Ad+M – Base 30,964 69 1.0429 0.0105<br />
Et+M – Base 43,962 83 1.5422 0.0111<br />
In+M – Base 30,572 66 1.0094 0.0104<br />
Ad+M – Adal 120 93 0.1271 0.0110<br />
Et+M – Etan 223 110 0.1048 0.0119<br />
Etan – Adal 12,894 103 0.5216 0.0114<br />
Et+M – Ad+M 12,997 103 0.4994 0.0115<br />
Ad+M – In+M 393 92 0.0335 0.0109<br />
Et+M – In+M 13,390 101 0.5329 0.0115<br />
Comparison ICER (£ per QALY) Quasi-CI<br />
Adal – Base 33,700 32,900 to 34,500<br />
Etan – Base 30,400 30,000 to 30,900<br />
Ad+M – Base 29,700 29,100 to 30,300<br />
Et+M – Base 28,500 28,100 to 28,900<br />
In+M – Base 30,300 29,700 to 30,900<br />
Ad+M – Adal Adal+MTX more effective than Adal alone; diff. cost not significant<br />
Et+M – Etan 2,120 Dominates to 4,280<br />
Etan – Adal 24,700 23,600 to 25,900<br />
Et+M – Ad+M 26,000 24,800 to 27,400<br />
Ad+M – In+M 11,700 6,500 to 59,200<br />
Et+M – In+M 25,100 24,000 to 26,300<br />
TABLE 144 Variation 13: TNF inhibitors third (late RA values) (100,000 patients)<br />
Option Cost (£) QSE QALYs QSE<br />
Adal 46,475 98 5.6051 0.0147<br />
Etan 59,709 120 6.3171 0.0156<br />
Adal+MTX 47,066 99 5.8852 0.0147<br />
Etan+MTX 59,706 120 6.2940 0.0157<br />
Infl+MTX 46,456 94 5.6372 0.0148<br />
Base 16,473 23 5.3979 0.0138<br />
Comparison Diff. cost (£) QSE Diff. QALY QSE<br />
Adal – Base 30,002 96 0.2073 0.0142<br />
Etan – Base 43,236 116 0.9192 0.0151<br />
Ad+M – Base 30,593 97 0.4873 0.0143<br />
Et+M – Base 43,232 116 0.8961 0.0153<br />
In+M – Base 29,983 92 0.2393 0.0142<br />
Ad+M – Adal 591 130 0.2801 0.0143<br />
Etan – Et+M 3 155 0.0231 0.0160<br />
Etan – Adal 13,234 143 0.7119 0.0151<br />
Et+M – Ad+M 12,639 144 0.4088 0.0154<br />
Ad+M – In+M 610 128 0.2480 0.0145<br />
Et+M – In+M 13,249 142 0.6568 0.0154<br />
continued


