

A systematic review of the effectiveness of adalimumab
A systematic review of the effectiveness of adalimumab
A systematic review of the effectiveness of adalimumab

Create successful ePaper yourself
Turn your PDF publications into a flip-book with our unique Google optimized e-Paper software.
214<br />
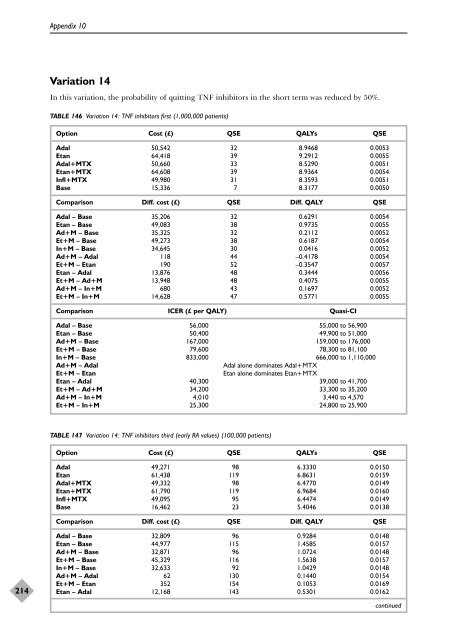
Appendix 10<br />
Variation 14<br />
In this variation, <strong>the</strong> probability <strong>of</strong> quitting TNF inhibitors in <strong>the</strong> short term was reduced by 50%.<br />
TABLE 146 Variation 14: TNF inhibitors first (1,000,000 patients)<br />
Option Cost (£) QSE QALYs QSE<br />
Adal 50,542 32 8.9468 0.0053<br />
Etan 64,418 39 9.2912 0.0055<br />
Adal+MTX 50,660 33 8.5290 0.0051<br />
Etan+MTX 64,608 39 8.9364 0.0054<br />
Infl+MTX 49,980 31 8.3593 0.0051<br />
Base 15,336 7 8.3177 0.0050<br />
Comparison Diff. cost (£) QSE Diff. QALY QSE<br />
Adal – Base 35,206 32 0.6291 0.0054<br />
Etan – Base 49,083 38 0.9735 0.0055<br />
Ad+M – Base 35,325 32 0.2112 0.0052<br />
Et+M – Base 49,273 38 0.6187 0.0054<br />
In+M – Base 34,645 30 0.0416 0.0052<br />
Ad+M – Adal 118 44 –0.4178 0.0054<br />
Et+M – Etan 190 52 –0.3547 0.0057<br />
Etan – Adal 13,876 48 0.3444 0.0056<br />
Et+M – Ad+M 13,948 48 0.4075 0.0055<br />
Ad+M – In+M 680 43 0.1697 0.0052<br />
Et+M – In+M 14,628 47 0.5771 0.0055<br />
Comparison ICER (£ per QALY) Quasi-CI<br />
Adal – Base 56,000 55,000 to 56,900<br />
Etan – Base 50,400 49,900 to 51,000<br />
Ad+M – Base 167,000 159,000 to 176,000<br />
Et+M – Base 79,600 78,300 to 81,100<br />
In+M – Base 833,000 666,000 to 1,110,000<br />
Ad+M – Adal Adal alone dominates Adal+MTX<br />
Et+M – Etan Etan alone dominates Etan+MTX<br />
Etan – Adal 40,300 39,000 to 41,700<br />
Et+M – Ad+M 34,200 33,300 to 35,200<br />
Ad+M – In+M 4,010 3,440 to 4,570<br />
Et+M – In+M 25,300 24,800 to 25,900<br />
TABLE 147 Variation 14: TNF inhibitors third (early RA values) (100,000 patients)<br />
Option Cost (£) QSE QALYs QSE<br />
Adal 49,271 98 6.3330 0.0150<br />
Etan 61,438 119 6.8631 0.0159<br />
Adal+MTX 49,332 98 6.4770 0.0149<br />
Etan+MTX 61,790 119 6.9684 0.0160<br />
Infl+MTX 49,095 95 6.4474 0.0149<br />
Base 16,462 23 5.4046 0.0138<br />
Comparison Diff. cost (£) QSE Diff. QALY QSE<br />
Adal – Base 32,809 96 0.9284 0.0148<br />
Etan – Base 44,977 115 1.4585 0.0157<br />
Ad+M – Base 32,871 96 1.0724 0.0148<br />
Et+M – Base 45,329 116 1.5638 0.0157<br />
In+M – Base 32,633 92 1.0429 0.0148<br />
Ad+M – Adal 62 130 0.1440 0.0154<br />
Et+M – Etan 352 154 0.1053 0.0169<br />
Etan – Adal 12,168 143 0.5301 0.0162<br />
continued


