

A systematic review of the effectiveness of adalimumab
A systematic review of the effectiveness of adalimumab
A systematic review of the effectiveness of adalimumab

Create successful ePaper yourself
Turn your PDF publications into a flip-book with our unique Google optimized e-Paper software.
206<br />
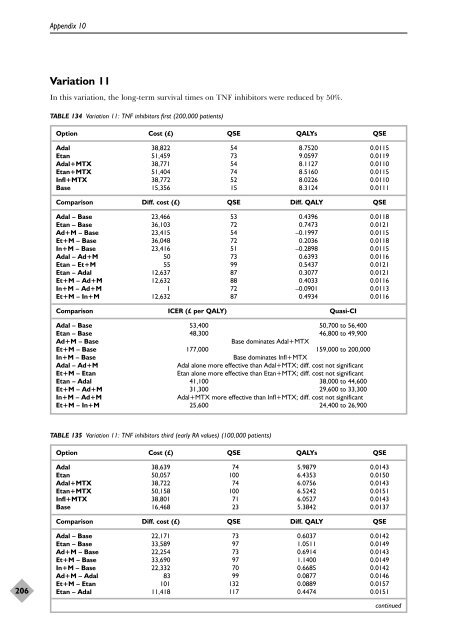
Appendix 10<br />
Variation 11<br />
In this variation, <strong>the</strong> long-term survival times on TNF inhibitors were reduced by 50%.<br />
TABLE 134 Variation 11: TNF inhibitors first (200,000 patients)<br />
Option Cost (£) QSE QALYs QSE<br />
Adal 38,822 54 8.7520 0.0115<br />
Etan 51,459 73 9.0597 0.0119<br />
Adal+MTX 38,771 54 8.1127 0.0110<br />
Etan+MTX 51,404 74 8.5160 0.0115<br />
Infl+MTX 38,772 52 8.0226 0.0110<br />
Base 15,356 15 8.3124 0.0111<br />
Comparison Diff. cost (£) QSE Diff. QALY QSE<br />
Adal – Base 23,466 53 0.4396 0.0118<br />
Etan – Base 36,103 72 0.7473 0.0121<br />
Ad+M – Base 23,415 54 –0.1997 0.0115<br />
Et+M – Base 36,048 72 0.2036 0.0118<br />
In+M – Base 23,416 51 –0.2898 0.0115<br />
Adal – Ad+M 50 73 0.6393 0.0116<br />
Etan – Et+M 55 99 0.5437 0.0121<br />
Etan – Adal 12,637 87 0.3077 0.0121<br />
Et+M – Ad+M 12,632 88 0.4033 0.0116<br />
In+M – Ad+M 1 72 –0.0901 0.0113<br />
Et+M – In+M 12,632 87 0.4934 0.0116<br />
Comparison ICER (£ per QALY) Quasi-CI<br />
Adal – Base 53,400 50,700 to 56,400<br />
Etan – Base 48,300 46,800 to 49,900<br />
Ad+M – Base Base dominates Adal+MTX<br />
Et+M – Base 177,000 159,000 to 200,000<br />
In+M – Base Base dominates Infl+MTX<br />
Adal – Ad+M Adal alone more effective than Adal+MTX; diff. cost not significant<br />
Et+M – Etan Etan alone more effective than Etan+MTX; diff. cost not significant<br />
Etan – Adal 41,100 38,000 to 44,600<br />
Et+M – Ad+M 31,300 29,600 to 33,300<br />
In+M – Ad+M Adal+MTX more effective than Infl+MTX; diff. cost not significant<br />
Et+M – In+M 25,600 24,400 to 26,900<br />
TABLE 135 Variation 11: TNF inhibitors third (early RA values) (100,000 patients)<br />
Option Cost (£) QSE QALYs QSE<br />
Adal 38,639 74 5.9879 0.0143<br />
Etan 50,057 100 6.4353 0.0150<br />
Adal+MTX 38,722 74 6.0756 0.0143<br />
Etan+MTX 50,158 100 6.5242 0.0151<br />
Infl+MTX 38,801 71 6.0527 0.0143<br />
Base 16,468 23 5.3842 0.0137<br />
Comparison Diff. cost (£) QSE Diff. QALY QSE<br />
Adal – Base 22,171 73 0.6037 0.0142<br />
Etan – Base 33,589 97 1.0511 0.0149<br />
Ad+M – Base 22,254 73 0.6914 0.0143<br />
Et+M – Base 33,690 97 1.1400 0.0149<br />
In+M – Base 22,332 70 0.6685 0.0142<br />
Ad+M – Adal 83 99 0.0877 0.0146<br />
Et+M – Etan 101 132 0.0889 0.0157<br />
Etan – Adal 11,418 117 0.4474 0.0151<br />
continued


