Proceedings e report - Firenze University Press
Proceedings e report - Firenze University Press
Proceedings e report - Firenze University Press

You also want an ePaper? Increase the reach of your titles
YUMPU automatically turns print PDFs into web optimized ePapers that Google loves.
WOOD SCIENCE FOR CONSERVATION OF CULTURAL HERITAGE<br />
recorded interferometric patterns is difficult and even ambiguous, a method for the determination of<br />
absolute values of phase at every point is needed. This is achieved by using a liquid crystal ARCoptix<br />
phase shifter with 10nm adjustment precision for recording several images with well-defined phase<br />
shifts between the object and reference beams. These images are used for phase unwrapping, and<br />
provide straightforward deformation data.<br />
The last element of the optical system is a narrow band interferometric filter placed right before the<br />
CCD matrix. The filter is chosen to block all wavelengths different from 532 ± 1nm which is the<br />
output wavelength from the Nd:Yag laser used in the instrument. Therefore, any ambient light is<br />
blocked and the interferometer can be used for the investigation of objects illuminated by sunlight or<br />
artificial light.<br />
The ESPI method proposed in this study has been based on the analysis of sound-induced vibration of<br />
the investigated surface. A signal with controlled frequency and amplitude is generated by a National<br />
Instrument NI PCI 6221 computer card, and further transformed by a Monacor Img Stage Line STA-<br />
302 amplifier. To generate a sound wave, a Monacor MPT – 177 loudspeaker with a frequency range<br />
from 3.5 to 20 kHz is utilized. The sound wave can induce vibrations of delaminated parts of a<br />
decorative layer when the generated wave is close enough to the resonant frequency. When the time of<br />
measurement is much longer than the vibration period, the intensity of light in the plane of the<br />
interferogram can be represented as a two dimmentional fringe pattern [11] and provides information<br />
on the amplitude of the object vibration. However the information is still relative because the intensity<br />
of light as well as its initial random phase in plane of interferogram are unknown. One may assume<br />
that the intensity of light is constant during the time of the measurement so its value is irrelevant for<br />
the final result of the analysis, but the map of the initial phase values is a key piece of information<br />
which must be found for an unambiguous analysis of the deformation of the surface.<br />
3. Data analysis<br />
In general, there are two types of phaseunwrapping<br />
procedures: temporal and spatial<br />
[12]. In the presented system, the first type of<br />
procedure is applied. In order to simplify the<br />
calibration of the instrument and the<br />
measuring procedure, a version of the<br />
normalized max-min phase shift scanning<br />
routine proposed by Vikhagen [13] was<br />
utilize. The process of fringe identification in<br />
the obtained interferogram is semiautomatic.<br />
A preliminary identification of fringes is done<br />
manually but the procedure of the assignment<br />
of particular pixels on the image to<br />
consecutive minima and maxima of the Bessel<br />
function is automatic – based on an iterative<br />
algorithm.<br />
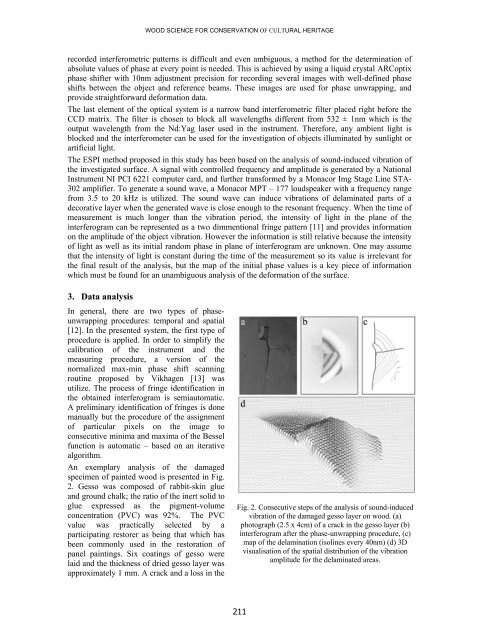
An exemplary analysis of the damaged<br />
specimen of painted wood is presented in Fig.<br />
2. Gesso was composed of rabbit-skin glue<br />
and ground chalk; the ratio of the inert solid to<br />
glue expressed as the pigment-volume<br />
concentration (PVC) was 92%. The PVC<br />
value was practically selected by a<br />
participating restorer as being that which has<br />
been commonly used in the restoration of<br />
panel paintings. Six coatings of gesso were<br />
laid and the thickness of dried gesso layer was<br />
approximately 1 mm. A crack and a loss in the<br />
Fig. 2. Consecutive steps of the analysis of sound-induced<br />
vibration of the damaged gesso layer on wood. (a)<br />
photograph (2.5 x 4cm) of a crack in the gesso layer (b)<br />
interferogram after the phase-unwrapping procedure, (c)<br />
map of the delamination (isolines every 40nm) (d) 3D<br />
visualisation of the spatial distribution of the vibration<br />
amplitude for the delaminated areas.<br />
211