- Page 2 and 3: DE SIGN MANUAL WASTEWATER TREATMENT
- Page 4 and 5: FOREWORD Rural and suburban communi
- Page 6 and 7: Chapter CONTENTS Page FOREWORD ACKN
- Page 8 and 9: Number FIGURES Wastewater Managemen
- Page 10 and 11: FIGURES Number Page ne Saturator Sa
- Page 12 and 13: FIGURES Number Page Use of Metal Ho
- Page 14 and 15: Number TABLES Selection of Disposal
- Page 16 and 17: Number TABLES (continued) Operati o
- Page 18 and 19: TABLES (continued) Number Page of D
- Page 20 and 21: In many areas, onsite systems have
- Page 22 and 23: 2.1 Introduction CHAPTER 2 STRATEGY
- Page 24 and 25: subsurface soil absorption is the p
- Page 26 and 27: features of the site (See 3.3.1 and
- Page 28 and 29: 2.2.2 System Selection With the pot
- Page 30 and 31: 2.2.4 Onsite System Management Past
- Page 32 and 33: determined largely by the physical
- Page 34 and 35: 16 - I ,
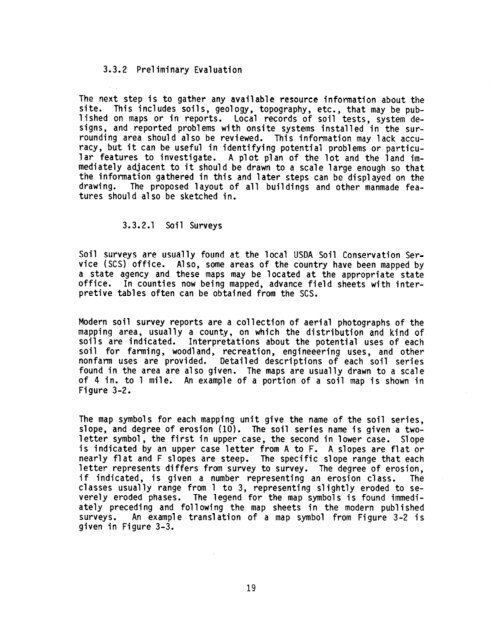
- Page 38 and 39: FIGURE 3-2 EXAMPLE OF A PORTION OF
- Page 40 and 41: Property USDA Texture Flooding Dept
- Page 42 and 43: TABLE 3-3 SOIL SURVEY REPORT INFORM
- Page 44 and 45: found for a subsurface soil absorpt
- Page 46 and 47: Instrument Supported - Abney Level:
- Page 48 and 49: FIGURE 3-8 PREPARATION OF SOIL SAMP
- Page 50 and 51: Sandy Loam + _. ,i . L Silt Loam Cl
- Page 52 and 53: Depth (Ft.) 0 2 4 6 8 10 12 14 Text
- Page 54 and 55: Grade Structureless Weak Moderate S
- Page 56 and 57: Excavated Soil Material (Tamped in
- Page 58 and 59: If test results agree with this tab
- Page 61 and 62: Percolation test FIGURE 3-15 PERCOL
- Page 63 and 64: mm..--- - --- FIGURE 3-16 COMPILATI
- Page 65 and 66: FIGURE 3-16 (continued) 0 Texture S
- Page 67 and 68: 13. Winneberger, J. T. Correlation
- Page 69 and 70: is the overall socioeconomic status
- Page 71 and 72: FIGURE 4-l FREQUENCY DISTRIBUTION F
- Page 73 and 74: extreme, however, minimum and maxim
- Page 75 and 76: 4i2.2.2 Individual Activity Contrib
- Page 77 and 78: and the resultant wastewater charac
- Page 79 and 80: TABLE 4-7 TYPICAL WASTEWATER FLOWS
- Page 81 and 82: TABLE 4-9 FIXTURE-UNITS PER FIXTURE
- Page 83 and 84: 4.3.2 Wastewater Quality The qualit
- Page 85 and 86: * FIGURE 4-3 STRATEGY FOR PREDICTIN
- Page 87 and 88:
12. Witt, M. Water Use in Rural Hom
- Page 89 and 90:
5.2 Water Conservation and Wastewat
- Page 91 and 92:
5.2.2 Water-Saving Devices, Fixture
- Page 93 and 94:
TABLE 5-2 (continued) Total Flo Red
- Page 95 and 96:
Generic Typea Description Pit Privy
- Page 97 and 98:
TABLE 5-4 WASTEWATER FLOW REDUCTION
- Page 99 and 100:
5.2.2.3 Clotheswashing Devices and
- Page 101 and 102:
Generic Typea Description Mixing Va
- Page 103 and 104:
TABLE 5-6 WASTEWATER FLOW REDUCTION
- Page 105 and 106:
TABLE 5-7 EXAMPLE POLLUTANT MASS RE
- Page 107 and 108:
FIGURE 5-l EXAMPLE STRATEGIES FOR M
- Page 109 and 110:
In most situations, projections of
- Page 111 and 112:
FIGURE 5-3 FLOW REDUCTION EFFECTS O
- Page 113 and 114:
5.7 References 1. 2. 3. 4. 5. 6. 7.
- Page 115 and 116:
6.1 Introduction CHAPTER 6 ONSITE T
- Page 117 and 118:
l SauJUOdtUo3 lesodsip pue JuJmeJJa
- Page 119 and 120:
l ALJadoJd aeo 14 JO a[aaas aou Kel
- Page 122 and 123:
‘($3) %gg 40 uo~a3npaJ e (3as/w t
- Page 124 and 125:
l salpnqs asaq 49 s3 LnsaJ ayq saz!
- Page 126 and 127:
hei!ues I I i I 1 I PCm I b j- I. -
- Page 128 and 129:
: apn L3u k suo!qeJap csuo3 Jaq30
- Page 130 and 131:
*an LeA a Lqeuoha -sanb 40 JJe pue
- Page 132 and 133:
(01) NOIlV3IlddV MO7 39tiVl llOzi 1
- Page 134 and 135:
l suo~~~puo3 Le~uawuoJ~Aua JaaLk4 p
- Page 136 and 137:
l 3n aqq Kq pazkJa23eJeq3 sh q3LqM
- Page 138:
.aJn7eJal k L aqq u k pays k Lqeasa
- Page 141 and 142:
9-9 37flVl pSil3111~ lN311IbWl1NI 3
- Page 143 and 144:
l paq aqq 40 aDe4Jns aACleJaLi4u .L
- Page 145 and 146:
‘8 Jaad&?ys ul pun04 aJle suoyd!s
- Page 148 and 149:
l Ja$lk4 ay3 ukqq!M JaaewaaseM 40 u
- Page 150 and 151:
‘SU !PJpJapun paaeJo4Jad JO aukoF
- Page 152 and 153:
P- &JLXLJ~e~Jl~Jd UJOJj C . - A 1a~
- Page 154 and 155:
a3ueua2ukew pue uobJeJad0 8.E.g LeJ
- Page 156 and 157:
sameualJnddv axanbas Jau il SLOJ7.t
- Page 158 and 159:
eJJaakJ3 u6isaa Z’6’E’g *asop
- Page 160 and 161:
318QaQEi33aNON 01-9 3msu simaotld N
- Page 162 and 163:
SNOIlQ~tl9I~N03 1NQld 39QI3Qd NOIlQ
- Page 164 and 165:
El-9 31av1 S3ItX-US 01313 1INt-l 31
- Page 166 and 167:
d. Method of Aeration Oxygen is tra
- Page 168 and 169:
contain electrical components, they
- Page 170 and 171:
control that results in power savin
- Page 172 and 173:
TABLE 6-16 OPERATIONAL PROBLEMS--EX
- Page 174 and 175:
I TRICKLING FILTFR FIGURE 6-12 EXAM
- Page 176 and 177:
presents suggested design ranges fo
- Page 178 and 179:
Item Media Tank Aeration System RBC
- Page 180 and 181:
Observation Filter Ponding Filter F
- Page 182 and 183:
TABLE.6-21 HALOGEN PROPERTIES (27)
- Page 184 and 185:
The use of chlorine as a disinfecta
- Page 186 and 187:
HOC1 , would predominate. It is cle
- Page 188 and 189:
6.5.2.5 Construction Features a. Fe
- Page 190 and 191:
e Wastewater FIGURE 6-14 IODINE SAT
- Page 192 and 193:
(experience with some units indicat
- Page 194 and 195:
directing flow through and around t
- Page 196 and 197:
FIGURE 6-17 TYPICAL UV STERILIZING
- Page 198 and 199:
Shigella TABLE 6-25 UV DOSAGE FOR S
- Page 200 and 201:
Cleaning of quartz glass enclosures
- Page 202 and 203:
the bubble diffuser units to lo-30
- Page 204 and 205:
TABLE 6-26 POTENTIAL ONSITE NITROGE
- Page 206 and 207:
Nitrification of septic tank efflue
- Page 208 and 209:
Influe? Effluent 0 Tank Denitrifica
- Page 210 and 211:
solution. It can be used to remove
- Page 212 and 213:
TABLE 6-27 POTENTIAL ONSITE PHOSPHO
- Page 214 and 215:
Anionic polyelectrolytes can be use
- Page 216 and 217:
component of the onsite treatment s
- Page 218 and 219:
7. 8. 9. 10. 11. 12. 13. 14. 15. 16
- Page 220 and 221:
30. 31. 32. 33. 34. 35. 36. 37. 38.
- Page 222 and 223:
58. 59. 60. 61. 62. 63. 64. 65. 66.
- Page 224 and 225:
7.1 Introduction CHAPTER 7 DISPOSAL
- Page 226 and 227:
7.2.1.2 System Selection The type o
- Page 228 and 229:
Distribution FIGURE 7-2 TYPICAL BED
- Page 230 and 231:
TABLE 7-l SITE CRITERIA FOR TRENCH
- Page 232 and 233:
TABLE 7-2 RECOMMENDED RATES OF WAST
- Page 234 and 235:
can slough off the sidewall. These
- Page 236 and 237:
FIGURE 7-3 ALTERNATING TRENCH SYSTE
- Page 238 and 239:
FIGURE 7-4 PROVISION OF A RESERVE A
- Page 240 and 241:
FIGURE 7-5 TRENCH SYSTEM INSTALLED
- Page 242 and 243:
TABLE 7-4 DOSING FREQUENCIES FOR VA
- Page 244 and 245:
The depth of the porous media may v
- Page 246 and 247:
Distr Pipe, FIGURE 7-6 TYPICAL INSP
- Page 248 and 249:
against freezing and to stabilize .
- Page 250 and 251:
Pertodic Deternvne Cause u O&loadin
- Page 252 and 253:
oils, and greases, can cause failur
- Page 254 and 255:
4" Inspection Pip FIGURE 7-9 SEEPAG
- Page 256 and 257:
The same guidelines used in locatin
- Page 258 and 259:
Straw, Hay or Fabric? FIGURE 7-10 T
- Page 260 and 261:
I tern Landscape Position Slope Typ
- Page 262 and 263:
The acceptable depth to an impermea
- Page 264 and 265:
FIGURE 7-12 PROPER ORIENTATION OF A
- Page 266 and 267:
Mound Height TABLE 7-9 DIMENSIONS F
- Page 268 and 269:
Example 7.1: Calculation of Mound D
- Page 270 and 271:
1.0 + 1.4 = - t 0.75 + 1.5 1 [ = (3
- Page 272 and 273:
. Fill Placement Step 1: Place the
- Page 274 and 275:
7.2.4.6 Considerations for Multi-Ho
- Page 276 and 277:
7.2.5.2 Application a. Site Conside
- Page 278 and 279:
7.2.6 Artificially Drained Systems
- Page 280 and 281:
---- FIGURE 7-17 UNDERDRAINS USED T
- Page 282 and 283:
periods, particularly on level site
- Page 284 and 285:
TABLE 7-11 DRAINAGE METHODS FOR VAR
- Page 286 and 287:
high water table elevation. To prev
- Page 288 and 289:
FIGURE 7-18 TYPICAL ELECTRO-OSMOSIS
- Page 290 and 291:
7.2.8.1 Design a. Single Line . Sin
- Page 292 and 293:
Inlet From Pretreatment or Previous
- Page 294 and 295:
watertight Pipe & Joints1 FIGURE 7-
- Page 296 and 297:
ox networks (see Figure 7-23). Howe
- Page 298 and 299:
280 s P 4
- Page 300 and 301:
FIGURE 7-26 LATERAL DETAIL - TEE TO
- Page 302 and 303:
To simplify the design of small pre
- Page 304 and 305:
FIGURE 7-29 RECOMMENDED MANIFOLD DI
- Page 306 and 307:
Step 3: Select lateral diameter. Fo
- Page 308 and 309:
Step 8: Select proper pump or sipho
- Page 310 and 311:
Friction loss in 25 ft 2. Velocity
- Page 312 and 313:
FIGURE 7-32 DISTRIBUTION NETWORK FO
- Page 314 and 315:
In summary, the final network desig
- Page 316 and 317:
7.2.8.3 Construction FIGURE 7-33 SC
- Page 318 and 319:
Since the network is pressurized, s
- Page 320 and 321:
FIGURE 7-35 CROSS SECTION OF TYPICA
- Page 322 and 323:
The capillary rise characteristic o
- Page 324 and 325:
The hydraulic loading rate is deter
- Page 326 and 327:
during the critical months of the y
- Page 328 and 329:
7.3.3 Evaporation and Evaporation/I
- Page 330 and 331:
FIGURE 7-37 TYPICAL EVAPORATION/INF
- Page 332 and 333:
October November December January F
- Page 334 and 335:
7.3.3.7 Seasonal, Multifamily, and
- Page 336 and 337:
13. 14. 15. 16. 17. 18. 19. 20. 21.
- Page 338 and 339:
38. 39. 40. 41. 42. 43. 44. 45. 46.
- Page 340 and 341:
The grease traps discussed here are
- Page 342 and 343:
Type of Fixture Restaurant kitchen
- Page 344 and 345:
Removable Slab Inlet --CL Tee with
- Page 346 and 347:
- 8.3.3 Factors Affecting Performan
- Page 348 and 349:
The pumping head is calculated by a
- Page 350 and 351:
liquid level drops, the weights los
- Page 352 and 353:
8.3.5 Construction The tank must be
- Page 354 and 355:
Hori FIGURE 8-6 TOP VIEW OF DIVERSI
- Page 356 and 357:
9.1 Introduction CHAPTER 9 RESIDUAL
- Page 358 and 359:
Parameter TABLE 9-2 CHARACTERISTICS
- Page 360 and 361:
Parameter Total Coliform Fecal Coli
- Page 362 and 363:
9.4.1 Land Disposal Four methods ca
- Page 364 and 365:
TABLE 9-4 (continued) Alternative D
- Page 366 and 367:
W z Process Lagooning (1)(13)(14) (
- Page 368 and 369:
Process Description Liouid Stream S
- Page 370 and 371:
11. 12. 13. 14. 15. 16. 17. 18. 19.
- Page 372 and 373:
Some of the techniques discussed ma
- Page 374 and 375:
10.3.1 State Agencies Except for th
- Page 376 and 377:
10.3.4.1 Private Nonprofit Institut
- Page 378 and 379:
10.4.1.1 Standards for Site Suitabi
- Page 380 and 381:
Scope of Activities Perform inspect
- Page 382 and 383:
Scope of Activities Perform necessa
- Page 384 and 385:
10.4.4.1 Inspections Inspections co
- Page 386 and 387:
SYSTEM 1. U.S. Bureau of Reclam$t~o
- Page 388 and 389:
FIGURE A-2 TEXTURAL TRIANGLE DEFINI
- Page 390 and 391:
Class Platelike. with one dimension
- Page 392 and 393:
saturation may be necessary to conf
- Page 394 and 395:
the porosity of soils containing mo
- Page 396 and 397:
FIGURE A-5 SOIL MOISTURE RETENTION
- Page 398 and 399:
A.3.3 Flow of Water Through Layered
- Page 400 and 401:
GLOSSARY A horizon: The horizon for
- Page 402 and 403:
following chemical flocculation; wi
- Page 404 and 405:
floodway: A channel built to carry
- Page 406 and 407:
ped: A unit of soil structure such
- Page 408 and 409:
solids: Material in the solid state
- Page 410 and 411:
TECHNICAL REPORT DATA (Please read