- Page 1 and 2:
LINDA H. TEUNTER Analysis</
- Page 4 and 5:
Analysis o
- Page 6 and 7:
Voorwoord Soms valt de appel echt n
- Page 8 and 9:
Contents 1 INTRODUCTION AND OVERVIE
- Page 10 and 11:
5.4.2.3.1 Inter Purchase Time .....
- Page 12 and 13:
1 INTRODUCTION AND OVERVIEW 1.1 Int
- Page 14 and 15:
generally generated from a smaller
- Page 16 and 17:
switching, purchase acceleration, c
- Page 18 and 19:
strategy change (decrease in promot
- Page 20 and 21:
of promotions, or
- Page 22 and 23:
characteristics are important in ex
- Page 24:
Chapter 5 are applied to study the
- Page 28 and 29:
2 THEORIES OF CONSUMER BUYING BEHAV
- Page 30 and 31:
systematically explored the decisio
- Page 32 and 33:
the part of the co
- Page 34 and 35:
As mentioned before, Figure 2.3 is
- Page 36 and 37:
product use coupled with the import
- Page 38 and 39:
2.3.2 Stimulus-Response Model Appli
- Page 40 and 41:
2.3.2.2 Operant Conditioning In ope
- Page 42 and 43:
X is very popular that it will brin
- Page 44 and 45:
But, in contrast, economic theory c
- Page 46 and 47:
compared to a perceived benchmark -
- Page 48 and 49:
High need-for-cognition (NFC) indiv
- Page 50 and 51:
2.3.4.2 Literature Overview Our rev
- Page 52 and 53:
The previously described research h
- Page 54 and 55:
has its deficiencies. Any purchase
- Page 56 and 57:
Chandon et al. 2000). But deal pron
- Page 58 and 59:
2.4 Concluding Remarks Regarding th
- Page 60:
stimulus-organism-response model) c
- Page 63 and 64:
Shoemaker 1987). Several factors ha
- Page 65 and 66:
such as display promotions. Althoug
- Page 67 and 68:
3.2.3 Type of resi
- Page 69 and 70:
3.2.5 Education Education links to
- Page 71 and 72:
these advantages therefore could be
- Page 73 and 74:
less likely to seek variety. More e
- Page 75 and 76:
3.3.1 Store Loyalty Store loyalty s
- Page 77 and 78:
more often (probab
- Page 79 and 80:
Table 3.12 continued Hypothesis H9a
- Page 81 and 82:
4.2.1 Brand Switching Brand switchi
- Page 83 and 84:
involvement purchases for most cons
- Page 85 and 86:
Neslin (1998), there is a great nee
- Page 87 and 88:
are called “attributions.” Attr
- Page 89 and 90:
and less than 2 percent by stockpil
- Page 91 and 92:
into a unit sales decomposition and
- Page 93 and 94:
4.3.4 Storability/Perishability Sto
- Page 95 and 96:
Economic theory ignores mental deci
- Page 97 and 98:
seeking (cf. Assael 1987, Desphande
- Page 99 and 100:
there another factor that is relate
- Page 101 and 102:
Pr(event) 90 = 1+ 1 z e − Here Z
- Page 103 and 104:
5.4.2 Sales <stron
- Page 105 and 106:
It represents the fraction
- Page 107 and 108:
96 We measure possible time acceler
- Page 109 and 110:
promotional post-promotional purcha
- Page 111 and 112:
( 12) CategoryExpansion effect : 10
- Page 114:
PART II EMPIRICAL ANALYSIS 103
- Page 117 and 118: more persons living together and di
- Page 119 and 120: 6.4 Linking Household and Store Dat
- Page 121 and 122: Table 6.1 contains the results <str
- Page 123 and 124: The age of the sho
- Page 125 and 126: Table 6.4: Frequency distribution <
- Page 128 and 129: 7 EMPIRICAL ANALYSIS ONE: DRIVERS O
- Page 130 and 131: Table 7.1: Operationalization <stro
- Page 132 and 133: during 435 shopping trips more than
- Page 134 and 135: The variables size, age, and cycle
- Page 136 and 137: 7.5 Results Drivers of</str
- Page 138 and 139: esponsive the households within tha
- Page 140 and 141: Table 7.3: Relationship promotion r
- Page 142 and 143: indication that decreasing marginal
- Page 144 and 145: Table 7.6: Relationship promotion r
- Page 146 and 147: Table 7.8: Relationship promotion r
- Page 148 and 149: Table 7.10: Relationship promotion
- Page 150 and 151: Table 7.12: Relationship promotion
- Page 152 and 153: Table 7.13: Relationship promotion
- Page 154 and 155: 7.5.2.8 Variety Seeking Two intrins
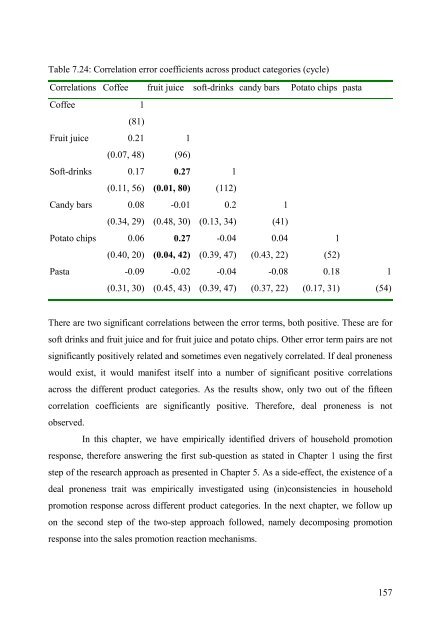
- Page 156 and 157: anymore. Therefore it is concluded
- Page 158 and 159: Thus, store loyalty and promotion r
- Page 160 and 161: dummies add up to one. This implies
- Page 162 and 163: Table 7.22: Overview empirical test
- Page 164 and 165: enacting-on-impulse hypothesis and
- Page 166 and 167: Table 7.23: Summary of</str
- Page 170 and 171: 8 EMPIRICAL ANALYSIS TWO: SALES PRO
- Page 172 and 173: for the two indicators for each pro
- Page 174 and 175: post-promotional estimates. The dif
- Page 176 and 177: 8.3 Testing the Hypotheses Relating
- Page 178 and 179: The number of bran
- Page 180 and 181: elationship between product categor
- Page 182 and 183: guide purchases once consumers are
- Page 184 and 185: 8.4 Household Consistencies The pri
- Page 186 and 187: a positive correlation between the
- Page 188 and 189: promotional quantity are positively
- Page 190 and 191: Table 8.7: Aggregated relative occu
- Page 192 and 193: Table 8.7, and Table 8.8. But what
- Page 194 and 195: promotional unit-sales across the c
- Page 196 and 197: Table 8.10: Unit-sales decompositio
- Page 198 and 199: Promotional unit s
- Page 200 and 201: The first decomposition discussed a
- Page 202 and 203: their purchases but also switched b
- Page 204 and 205: 9 CONCLUSIONS, DISCUSSION, AND SUGG
- Page 206 and 207: drinks, fruit juice, cof</s
- Page 208 and 209: Summarizing, the results are in acc
- Page 210 and 211: to buy less than what it normally p
- Page 212 and 213: favorite brands is about 40 percent
- Page 214 and 215: (Van Heerde et al. 2001, 2002), the
- Page 216 and 217: juice products. Thus, in general, a
- Page 218 and 219:
REFERENCES Abe, M. (1995), "A nonpa
- Page 220 and 221:
Bawa, K., Srinivasan, S.S. and R.K.
- Page 222 and 223:
Bucklin, R.E. and Sunil Gupta (1992
- Page 224 and 225:
Dekimpe, M.G. and D.M. Hanssens (19
- Page 226 and 227:
Foxall, G.R. and R.E. Goldsmith (19
- Page 228 and 229:
Huff, D. (1964), “Defining and Es
- Page 230 and 231:
Kim, B., Srinivasan, K. and R.T. Wi
- Page 232 and 233:
Lilien, G.L., Kotler, P. and K.S. M
- Page 234 and 235:
Narasimhan, C., Neslin, S.A. and Se
- Page 236 and 237:
Robertson, T.S., Zielinski, J. and
- Page 238 and 239:
Stewart, J. (1991), Econometrics, P
- Page 240 and 241:
Wedel, M., Kamakura, W.A., DeSarbo,
- Page 242:
APPENDIX A3: Operationalization Soc
- Page 245 and 246:
Table A4.1 continued Article Promot
- Page 248 and 249:
APPENDIX A6: Overview Variables Inv
- Page 250 and 251:
APPENDIX A7: Empirical Anal
- Page 252 and 253:
Table A7.1 continued Symbol Descrip
- Page 254 and 255:
Table A7.2 continued Variable B 1 S
- Page 256 and 257:
Table A7.3 continued Variable N1 N2
- Page 258 and 259:
Table A7.4 continued Variable B S.E
- Page 260 and 261:
Table A7.5 continued Variable B S.E
- Page 262 and 263:
APPENDIX A8: Empirical Anal
- Page 264 and 265:
Table A8.2: Product category rating
- Page 266 and 267:
Product Category 1 Product Category
- Page 268 and 269:
Table A8.3 continued Main effects Q
- Page 270 and 271:
Samenvatting Consumenten worden vee
- Page 272 and 273:
Deze gegevens worden gekoppeld aan
- Page 274:
Curriculum Vitae Linda H. Teunter w
- Page 277 and 278:
Title: Layout and Routing Methods f
- Page 279 and 280:
Title: The Business of</str
- Page 281:
Analysis o