- Page 1 and 2:
LINDA H. TEUNTER Analysis</
- Page 4 and 5:
Analysis o
- Page 6 and 7:
Voorwoord Soms valt de appel echt n
- Page 8 and 9:
Contents 1 INTRODUCTION AND OVERVIE
- Page 10 and 11:
5.4.2.3.1 Inter Purchase Time .....
- Page 12 and 13:
1 INTRODUCTION AND OVERVIEW 1.1 Int
- Page 14 and 15:
generally generated from a smaller
- Page 16 and 17:
switching, purchase acceleration, c
- Page 18 and 19:
strategy change (decrease in promot
- Page 20 and 21:
of promotions, or
- Page 22 and 23:
characteristics are important in ex
- Page 24:
Chapter 5 are applied to study the
- Page 28 and 29:
2 THEORIES OF CONSUMER BUYING BEHAV
- Page 30 and 31:
systematically explored the decisio
- Page 32 and 33:
the part of the co
- Page 34 and 35:
As mentioned before, Figure 2.3 is
- Page 36 and 37:
product use coupled with the import
- Page 38 and 39:
2.3.2 Stimulus-Response Model Appli
- Page 40 and 41:
2.3.2.2 Operant Conditioning In ope
- Page 42 and 43:
X is very popular that it will brin
- Page 44 and 45:
But, in contrast, economic theory c
- Page 46 and 47:
compared to a perceived benchmark -
- Page 48 and 49:
High need-for-cognition (NFC) indiv
- Page 50 and 51:
2.3.4.2 Literature Overview Our rev
- Page 52 and 53:
The previously described research h
- Page 54 and 55:
has its deficiencies. Any purchase
- Page 56 and 57:
Chandon et al. 2000). But deal pron
- Page 58 and 59:
2.4 Concluding Remarks Regarding th
- Page 60:
stimulus-organism-response model) c
- Page 63 and 64:
Shoemaker 1987). Several factors ha
- Page 65 and 66:
such as display promotions. Althoug
- Page 67 and 68:
3.2.3 Type of resi
- Page 69 and 70:
3.2.5 Education Education links to
- Page 71 and 72:
these advantages therefore could be
- Page 73 and 74:
less likely to seek variety. More e
- Page 75 and 76:
3.3.1 Store Loyalty Store loyalty s
- Page 77 and 78:
more often (probab
- Page 79 and 80:
Table 3.12 continued Hypothesis H9a
- Page 81 and 82:
4.2.1 Brand Switching Brand switchi
- Page 83 and 84:
involvement purchases for most cons
- Page 85 and 86:
Neslin (1998), there is a great nee
- Page 87 and 88:
are called “attributions.” Attr
- Page 89 and 90:
and less than 2 percent by stockpil
- Page 91 and 92:
into a unit sales decomposition and
- Page 93 and 94:
4.3.4 Storability/Perishability Sto
- Page 95 and 96:
Economic theory ignores mental deci
- Page 97 and 98:
seeking (cf. Assael 1987, Desphande
- Page 99 and 100:
there another factor that is relate
- Page 101 and 102:
Pr(event) 90 = 1+ 1 z e − Here Z
- Page 103 and 104:
5.4.2 Sales <stron
- Page 105 and 106:
It represents the fraction
- Page 107 and 108:
96 We measure possible time acceler
- Page 109 and 110:
promotional post-promotional purcha
- Page 111 and 112:
( 12) CategoryExpansion effect : 10
- Page 114:
PART II EMPIRICAL ANALYSIS 103
- Page 117 and 118:
more persons living together and di
- Page 119 and 120:
6.4 Linking Household and Store Dat
- Page 121 and 122:
Table 6.1 contains the results <str
- Page 123 and 124:
The age of the sho
- Page 125 and 126:
Table 6.4: Frequency distribution <
- Page 128 and 129:
7 EMPIRICAL ANALYSIS ONE: DRIVERS O
- Page 130 and 131:
Table 7.1: Operationalization <stro
- Page 132 and 133:
during 435 shopping trips more than
- Page 134 and 135:
The variables size, age, and cycle
- Page 136 and 137:
7.5 Results Drivers of</str
- Page 138 and 139:
esponsive the households within tha
- Page 140 and 141:
Table 7.3: Relationship promotion r
- Page 142 and 143:
indication that decreasing marginal
- Page 144 and 145:
Table 7.6: Relationship promotion r
- Page 146 and 147:
Table 7.8: Relationship promotion r
- Page 148 and 149: Table 7.10: Relationship promotion
- Page 150 and 151: Table 7.12: Relationship promotion
- Page 152 and 153: Table 7.13: Relationship promotion
- Page 154 and 155: 7.5.2.8 Variety Seeking Two intrins
- Page 156 and 157: anymore. Therefore it is concluded
- Page 158 and 159: Thus, store loyalty and promotion r
- Page 160 and 161: dummies add up to one. This implies
- Page 162 and 163: Table 7.22: Overview empirical test
- Page 164 and 165: enacting-on-impulse hypothesis and
- Page 166 and 167: Table 7.23: Summary of</str
- Page 168: Table 7.24: Correlation error coeff
- Page 171 and 172: another category? Or do households
- Page 173 and 174: and unweighted. With respect to the
- Page 175 and 176: 164 In general, the average quantit
- Page 177 and 178: Purchase frequency is defined as th
- Page 179 and 180: Table 8.3: Product category rating
- Page 181 and 182: Table 8.4: Pearson correlation betw
- Page 183 and 184: We hypothesized that within impulse
- Page 185 and 186: measure (PU). Referring to Figure A
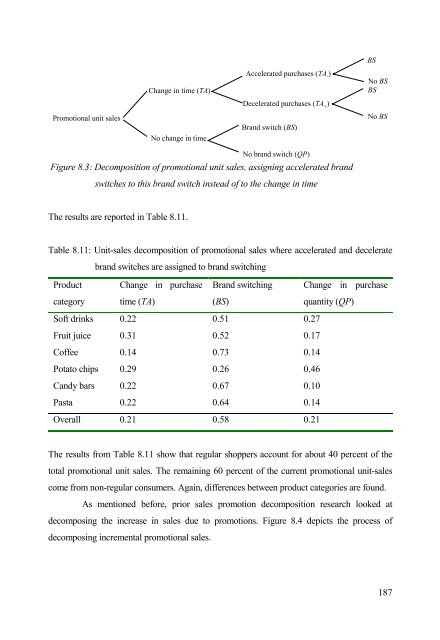
- Page 187 and 188: Table 8.6: Significant within categ
- Page 189 and 190: looked at this promotional bump dec
- Page 191 and 192: Table 8.8: Differences in promotion
- Page 193 and 194: approach (about one third) are much
- Page 195 and 196: promotions lead to large purchase t
- Page 197: studies. Promotion
- Page 201 and 202: categories revealed that the strong
- Page 203 and 204: degree. When households switch bran
- Page 205 and 206: specific sales promotion reaction m
- Page 207 and 208: increasing (Inman and Winer 1998),
- Page 209 and 210: indirectly from promotional purchas
- Page 211 and 212: quantity downward for potato chips.
- Page 213 and 214: 9.2.2.3 Deal Proneness With respect
- Page 215 and 216: 204 related to promotion response.
- Page 217 and 218: influenced by out-of</stron
- Page 219 and 220: Andrews, K.Z. (1997), “Do Marketi
- Page 221 and 222: Blattberg, R.C., Eppen, G.D. and J.
- Page 223 and 224: Chintagunta, P. (1993), “Investig
- Page 225 and 226: East, R. and K. Hammond (1996), “
- Page 227 and 228: Gupta, Sachin and P.K. Chintagunta
- Page 229 and 230: Kahn, B.E., Morrison, D.G.and G.P.
- Page 231 and 232: Lattin, J.M. and R.E. Bucklin (1989
- Page 233 and 234: McAlister, L. and E. Pessemier (198
- Page 235 and 236: Petty, R.E. and J.T. Cacioppo (1981
- Page 237 and 238: Shimp, T.A. (1990). Promoti
- Page 239 and 240: Van Trijp, H.C.M. and J.B.E.M. Stee
- Page 241 and 242: Winer, R.S., Bucklin, R.E., Deighto
- Page 244 and 245: APPENDIX A4: Research Overview Tabl
- Page 246: Table A4.1 continued Article Promot
- Page 249 and 250:
� Size of munici
- Page 251 and 252:
Table A7.1 continued Symbol Descrip
- Page 253 and 254:
Table A7.2: Data legitimacy check (
- Page 255 and 256:
Table A7.3: Results binary logistic
- Page 257 and 258:
Table A7.4: Results interacting wit
- Page 259 and 260:
Table A7.5: Results age and size no
- Page 261 and 262:
Table A7.5 continued Variable B S.E
- Page 263 and 264:
Table A8.1 continued Impulse BS TA
- Page 265 and 266:
Table A8.2 continued Number <strong
- Page 267 and 268:
Table A8.3: Relative occurrence and
- Page 269 and 270:
Figure A8.2: Decomposing total prom
- Page 271 and 272:
interessante aanbieding is. Combina
- Page 273 and 274:
aantalmerken in een categorie en im
- Page 276 and 277:
ERASMUS RESEARCH INSTITUTE OF MANAG
- Page 278 and 279:
Title: Beyond Generics;A closer loo
- Page 280 and 281:
Title: Planning and Control Concept