

Analysis of Sales Promotion Effects on Household Purchase Behavior
Analysis of Sales Promotion Effects on Household Purchase Behavior
Analysis of Sales Promotion Effects on Household Purchase Behavior

Create successful ePaper yourself
Turn your PDF publications into a flip-book with our unique Google optimized e-Paper software.
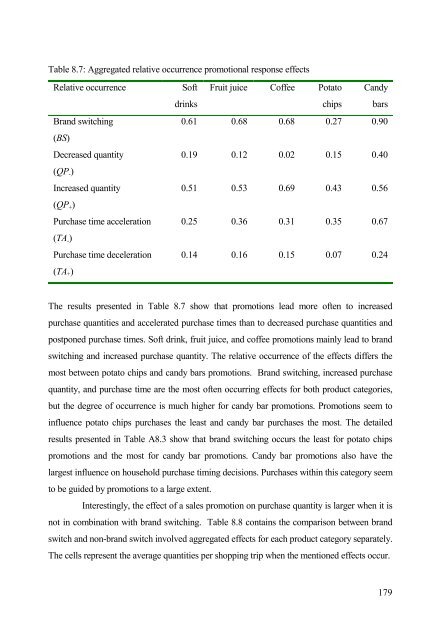
Table 8.7: Aggregated relative occurrence promoti<strong>on</strong>al resp<strong>on</strong>se effects<br />
Relative occurrence S<str<strong>on</strong>g>of</str<strong>on</strong>g>t<br />
Brand switching<br />
(BS)<br />
Decreased quantity<br />
(QP-)<br />
Increased quantity<br />
(QP+)<br />
<strong>Purchase</strong> time accelerati<strong>on</strong><br />
(TA-)<br />
<strong>Purchase</strong> time decelerati<strong>on</strong><br />
(TA+)<br />
drinks<br />
Fruit juice C<str<strong>on</strong>g>of</str<strong>on</strong>g>fee Potato<br />
chips<br />
Candy<br />
bars<br />
0.61 0.68 0.68 0.27 0.90<br />
0.19 0.12 0.02 0.15 0.40<br />
0.51 0.53 0.69 0.43 0.56<br />
0.25 0.36 0.31 0.35 0.67<br />
0.14 0.16 0.15 0.07 0.24<br />
The results presented in Table 8.7 show that promoti<strong>on</strong>s lead more <str<strong>on</strong>g>of</str<strong>on</strong>g>ten to increased<br />
purchase quantities and accelerated purchase times than to decreased purchase quantities and<br />
postp<strong>on</strong>ed purchase times. S<str<strong>on</strong>g>of</str<strong>on</strong>g>t drink, fruit juice, and c<str<strong>on</strong>g>of</str<strong>on</strong>g>fee promoti<strong>on</strong>s mainly lead to brand<br />
switching and increased purchase quantity. The relative occurrence <str<strong>on</strong>g>of</str<strong>on</strong>g> the effects differs the<br />
most between potato chips and candy bars promoti<strong>on</strong>s. Brand switching, increased purchase<br />
quantity, and purchase time are the most <str<strong>on</strong>g>of</str<strong>on</strong>g>ten occurring effects for both product categories,<br />
but the degree <str<strong>on</strong>g>of</str<strong>on</strong>g> occurrence is much higher for candy bar promoti<strong>on</strong>s. <str<strong>on</strong>g>Promoti<strong>on</strong></str<strong>on</strong>g>s seem to<br />
influence potato chips purchases the least and candy bar purchases the most. The detailed<br />
results presented in Table A8.3 show that brand switching occurs the least for potato chips<br />
promoti<strong>on</strong>s and the most for candy bar promoti<strong>on</strong>s. Candy bar promoti<strong>on</strong>s also have the<br />
largest influence <strong>on</strong> household purchase timing decisi<strong>on</strong>s. <strong>Purchase</strong>s within this category seem<br />
to be guided by promoti<strong>on</strong>s to a large extent.<br />
Interestingly, the effect <str<strong>on</strong>g>of</str<strong>on</strong>g> a sales promoti<strong>on</strong> <strong>on</strong> purchase quantity is larger when it is<br />
not in combinati<strong>on</strong> with brand switching. Table 8.8 c<strong>on</strong>tains the comparis<strong>on</strong> between brand<br />
switch and n<strong>on</strong>-brand switch involved aggregated effects for each product category separately.<br />
The cells represent the average quantities per shopping trip when the menti<strong>on</strong>ed effects occur.<br />
179


