

Statistical Analysis of Trends in the Red River Over a 45 Year Period
Statistical Analysis of Trends in the Red River Over a 45 Year Period
Statistical Analysis of Trends in the Red River Over a 45 Year Period

You also want an ePaper? Increase the reach of your titles
YUMPU automatically turns print PDFs into web optimized ePapers that Google loves.
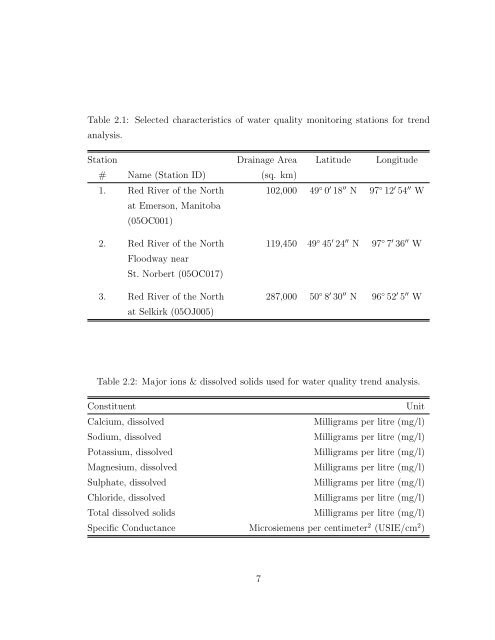
Table 2.1: Selected characteristics <strong>of</strong> water quality monitor<strong>in</strong>g stations for trend<br />
analysis.<br />
Station Dra<strong>in</strong>age Area Latitude Longitude<br />
# Name (Station ID) (sq. km)<br />
1. <strong>Red</strong> <strong>River</strong> <strong>of</strong> <strong>the</strong> North<br />
at Emerson, Manitoba<br />
(05OC001)<br />
102,000 49 ◦ 0 ′ 18 ′′ N 97 ◦ 12 ′ 54 ′′ W<br />
2. <strong>Red</strong> <strong>River</strong> <strong>of</strong> <strong>the</strong> North<br />
Floodway near<br />
St. Norbert (05OC017)<br />
3. <strong>Red</strong> <strong>River</strong> <strong>of</strong> <strong>the</strong> North<br />
at Selkirk (05OJ005)<br />
119,<strong>45</strong>0 49 ◦ <strong>45</strong> ′ 24 ′′ N 97 ◦ 7 ′ 36 ′′ W<br />
287,000 50 ◦ 8 ′ 30 ′′ N 96 ◦ 52 ′ 5 ′′ W<br />
Table 2.2: Major ions & dissolved solids used for water quality trend analysis.<br />
Constituent<br />
Unit<br />
Calcium, dissolved<br />
Milligrams per litre (mg/l)<br />
Sodium, dissolved<br />
Milligrams per litre (mg/l)<br />
Potassium, dissolved<br />
Milligrams per litre (mg/l)<br />
Magnesium, dissolved<br />
Milligrams per litre (mg/l)<br />
Sulphate, dissolved<br />
Milligrams per litre (mg/l)<br />
Chloride, dissolved<br />
Milligrams per litre (mg/l)<br />
Total dissolved solids<br />
Milligrams per litre (mg/l)<br />
Specific Conductance Microsiemens per centimeter 2 (USIE/cm 2 )<br />
7


