Statistical Analysis of Trends in the Red River Over a 45 Year Period
Statistical Analysis of Trends in the Red River Over a 45 Year Period
Statistical Analysis of Trends in the Red River Over a 45 Year Period
You also want an ePaper? Increase the reach of your titles
YUMPU automatically turns print PDFs into web optimized ePapers that Google loves.
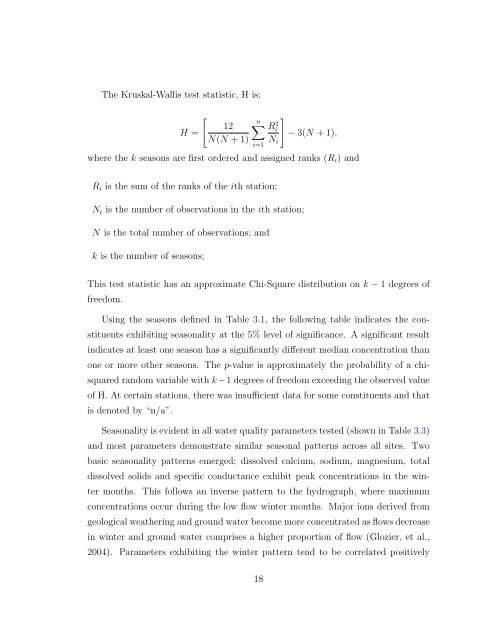
The Kruskal-Wallis test statistic, H is;<br />
[<br />
12<br />
H =<br />
N(N + 1)<br />
n∑<br />
i=1<br />
]<br />
Ri<br />
2 − 3(N + 1),<br />
N i<br />
where <strong>the</strong> k seasons are first ordered and assigned ranks (R i ) and<br />
R i is <strong>the</strong> sum <strong>of</strong> <strong>the</strong> ranks <strong>of</strong> <strong>the</strong> ith station;<br />
N i is <strong>the</strong> number <strong>of</strong> observations <strong>in</strong> <strong>the</strong> ith station;<br />
N is <strong>the</strong> total number <strong>of</strong> observations; and<br />
k is <strong>the</strong> number <strong>of</strong> seasons;<br />
This test statistic has an approximate Chi-Square distribution on k − 1 degrees <strong>of</strong><br />
freedom.<br />
Us<strong>in</strong>g <strong>the</strong> seasons def<strong>in</strong>ed <strong>in</strong> Table 3.1, <strong>the</strong> follow<strong>in</strong>g table <strong>in</strong>dicates <strong>the</strong> constituents<br />
exhibit<strong>in</strong>g seasonality at <strong>the</strong> 5% level <strong>of</strong> significance. A significant result<br />
<strong>in</strong>dicates at least one season has a significantly different median concentration than<br />
one or more o<strong>the</strong>r seasons. The p-value is approximately <strong>the</strong> probability <strong>of</strong> a chisquared<br />
random variable with k −1 degrees <strong>of</strong> freedom exceed<strong>in</strong>g <strong>the</strong> observed value<br />
<strong>of</strong> H. At certa<strong>in</strong> stations, <strong>the</strong>re was <strong>in</strong>sufficient data for some constituents and that<br />
is denoted by “n/a”.<br />
Seasonality is evident <strong>in</strong> all water quality parameters tested (shown <strong>in</strong> Table 3.3)<br />
and most parameters demonstrate similar seasonal patterns across all sites. Two<br />
basic seasonality patterns emerged; dissolved calcium, sodium, magnesium, total<br />
dissolved solids and specific conductance exhibit peak concentrations <strong>in</strong> <strong>the</strong> w<strong>in</strong>ter<br />
months. This follows an <strong>in</strong>verse pattern to <strong>the</strong> hydrograph, where maximum<br />
concentrations occur dur<strong>in</strong>g <strong>the</strong> low flow w<strong>in</strong>ter months. Major ions derived from<br />
geological wea<strong>the</strong>r<strong>in</strong>g and ground water become more concentrated as flows decrease<br />
<strong>in</strong> w<strong>in</strong>ter and ground water comprises a higher proportion <strong>of</strong> flow (Glozier, et al.,<br />
2004). Parameters exhibit<strong>in</strong>g <strong>the</strong> w<strong>in</strong>ter pattern tend to be correlated positively<br />
18


