

Statistical Analysis of Trends in the Red River Over a 45 Year Period
Statistical Analysis of Trends in the Red River Over a 45 Year Period
Statistical Analysis of Trends in the Red River Over a 45 Year Period

You also want an ePaper? Increase the reach of your titles
YUMPU automatically turns print PDFs into web optimized ePapers that Google loves.
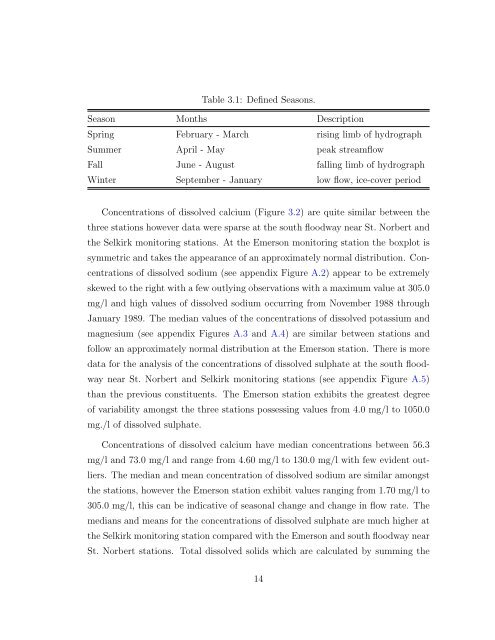
Table 3.1: Def<strong>in</strong>ed Seasons.<br />
Season Months Description<br />
Spr<strong>in</strong>g February - March ris<strong>in</strong>g limb <strong>of</strong> hydrograph<br />
Summer April - May peak streamflow<br />
Fall June - August fall<strong>in</strong>g limb <strong>of</strong> hydrograph<br />
W<strong>in</strong>ter September - January low flow, ice-cover period<br />
Concentrations <strong>of</strong> dissolved calcium (Figure 3.2) are quite similar between <strong>the</strong><br />
three stations however data were sparse at <strong>the</strong> south floodway near St. Norbert and<br />
<strong>the</strong> Selkirk monitor<strong>in</strong>g stations. At <strong>the</strong> Emerson monitor<strong>in</strong>g station <strong>the</strong> boxplot is<br />
symmetric and takes <strong>the</strong> appearance <strong>of</strong> an approximately normal distribution. Concentrations<br />
<strong>of</strong> dissolved sodium (see appendix Figure A.2) appear to be extremely<br />
skewed to <strong>the</strong> right with a few outly<strong>in</strong>g observations with a maximum value at 305.0<br />
mg/l and high values <strong>of</strong> dissolved sodium occurr<strong>in</strong>g from November 1988 through<br />
January 1989. The median values <strong>of</strong> <strong>the</strong> concentrations <strong>of</strong> dissolved potassium and<br />
magnesium (see appendix Figures A.3 and A.4) are similar between stations and<br />
follow an approximately normal distribution at <strong>the</strong> Emerson station. There is more<br />
data for <strong>the</strong> analysis <strong>of</strong> <strong>the</strong> concentrations <strong>of</strong> dissolved sulphate at <strong>the</strong> south floodway<br />
near St. Norbert and Selkirk monitor<strong>in</strong>g stations (see appendix Figure A.5)<br />
than <strong>the</strong> previous constituents. The Emerson station exhibits <strong>the</strong> greatest degree<br />
<strong>of</strong> variability amongst <strong>the</strong> three stations possess<strong>in</strong>g values from 4.0 mg/l to 1050.0<br />
mg./l <strong>of</strong> dissolved sulphate.<br />
Concentrations <strong>of</strong> dissolved calcium have median concentrations between 56.3<br />
mg/l and 73.0 mg/l and range from 4.60 mg/l to 130.0 mg/l with few evident outliers.<br />
The median and mean concentration <strong>of</strong> dissolved sodium are similar amongst<br />
<strong>the</strong> stations, however <strong>the</strong> Emerson station exhibit values rang<strong>in</strong>g from 1.70 mg/l to<br />
305.0 mg/l, this can be <strong>in</strong>dicative <strong>of</strong> seasonal change and change <strong>in</strong> flow rate. The<br />
medians and means for <strong>the</strong> concentrations <strong>of</strong> dissolved sulphate are much higher at<br />
<strong>the</strong> Selkirk monitor<strong>in</strong>g station compared with <strong>the</strong> Emerson and south floodway near<br />
St. Norbert stations. Total dissolved solids which are calculated by summ<strong>in</strong>g <strong>the</strong><br />
14


