

Statistical Analysis of Trends in the Red River Over a 45 Year Period
Statistical Analysis of Trends in the Red River Over a 45 Year Period
Statistical Analysis of Trends in the Red River Over a 45 Year Period

Create successful ePaper yourself
Turn your PDF publications into a flip-book with our unique Google optimized e-Paper software.
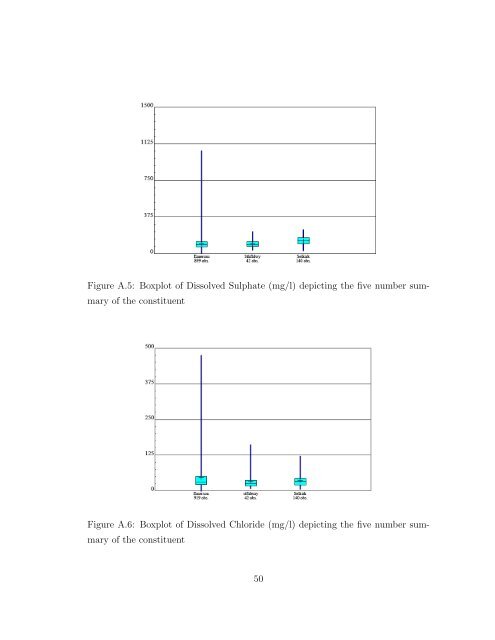
Figure A.5: Boxplot <strong>of</strong> Dissolved Sulphate (mg/l) depict<strong>in</strong>g <strong>the</strong> five number summary<br />
<strong>of</strong> <strong>the</strong> constituent<br />
Figure A.6: Boxplot <strong>of</strong> Dissolved Chloride (mg/l) depict<strong>in</strong>g <strong>the</strong> five number summary<br />
<strong>of</strong> <strong>the</strong> constituent<br />
50


