

Statistical Analysis of Trends in the Red River Over a 45 Year Period
Statistical Analysis of Trends in the Red River Over a 45 Year Period
Statistical Analysis of Trends in the Red River Over a 45 Year Period
SHOW LESS

Create successful ePaper yourself
Turn your PDF publications into a flip-book with our unique Google optimized e-Paper software.
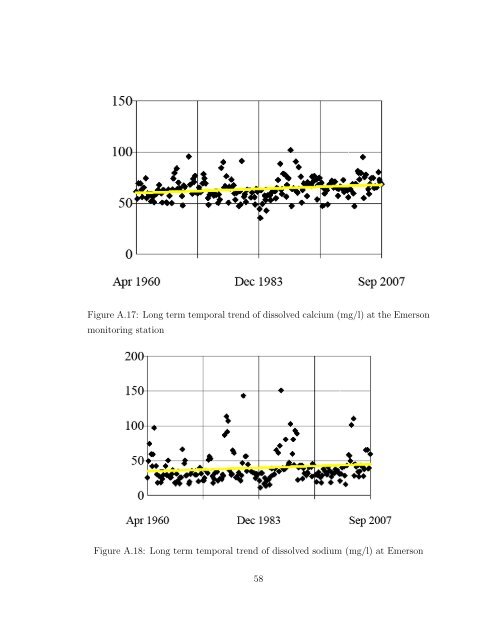
Figure A.17: Long term temporal trend <strong>of</strong> dissolved calcium (mg/l) at <strong>the</strong> Emerson<br />
monitor<strong>in</strong>g station<br />
Figure A.18: Long term temporal trend <strong>of</strong> dissolved sodium (mg/l) at Emerson<br />
58


