

Statistical Analysis of Trends in the Red River Over a 45 Year Period
Statistical Analysis of Trends in the Red River Over a 45 Year Period
Statistical Analysis of Trends in the Red River Over a 45 Year Period
SHOW LESS

You also want an ePaper? Increase the reach of your titles
YUMPU automatically turns print PDFs into web optimized ePapers that Google loves.
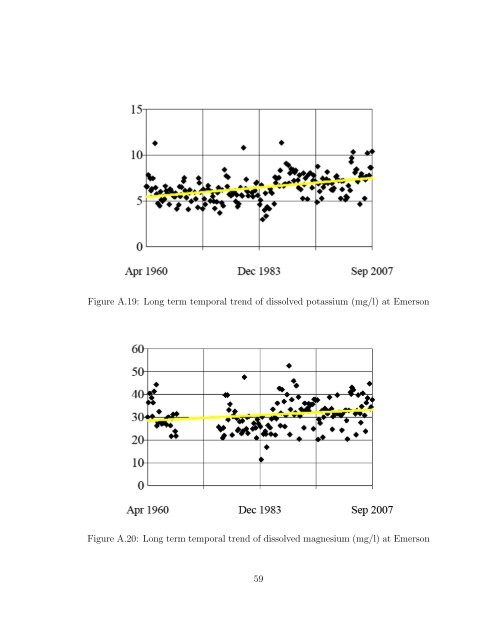
Figure A.19: Long term temporal trend <strong>of</strong> dissolved potassium (mg/l) at Emerson<br />
Figure A.20: Long term temporal trend <strong>of</strong> dissolved magnesium (mg/l) at Emerson<br />
59


