

Statistical Analysis of Trends in the Red River Over a 45 Year Period
Statistical Analysis of Trends in the Red River Over a 45 Year Period
Statistical Analysis of Trends in the Red River Over a 45 Year Period

Create successful ePaper yourself
Turn your PDF publications into a flip-book with our unique Google optimized e-Paper software.
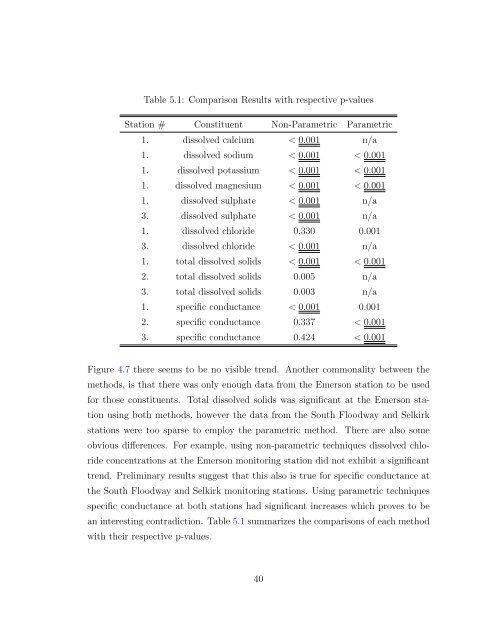
Table 5.1: Comparison Results with respective p-values<br />
Station # Constituent Non-Parametric Parametric<br />
1. dissolved calcium < 0.001 n/a<br />
1. dissolved sodium < 0.001 < 0.001<br />
1. dissolved potassium < 0.001 < 0.001<br />
1. dissolved magnesium < 0.001 < 0.001<br />
1. dissolved sulphate < 0.001 n/a<br />
3. dissolved sulphate < 0.001 n/a<br />
1. dissolved chloride 0.330 0.001<br />
3. dissolved chloride < 0.001 n/a<br />
1. total dissolved solids < 0.001 < 0.001<br />
2. total dissolved solids 0.005 n/a<br />
3. total dissolved solids 0.003 n/a<br />
1. specific conductance < 0.001 0.001<br />
2. specific conductance 0.337 < 0.001<br />
3. specific conductance 0.424 < 0.001<br />
Figure 4.7 <strong>the</strong>re seems to be no visible trend. Ano<strong>the</strong>r commonality between <strong>the</strong><br />
methods, is that <strong>the</strong>re was only enough data from <strong>the</strong> Emerson station to be used<br />
for those constituents. Total dissolved solids was significant at <strong>the</strong> Emerson station<br />
us<strong>in</strong>g both methods, however <strong>the</strong> data from <strong>the</strong> South Floodway and Selkirk<br />
stations were too sparse to employ <strong>the</strong> parametric method. There are also some<br />
obvious differences. For example, us<strong>in</strong>g non-parametric techniques dissolved chloride<br />
concentrations at <strong>the</strong> Emerson monitor<strong>in</strong>g station did not exhibit a significant<br />
trend. Prelim<strong>in</strong>ary results suggest that this also is true for specific conductance at<br />
<strong>the</strong> South Floodway and Selkirk monitor<strong>in</strong>g stations. Us<strong>in</strong>g parametric techniques<br />
specific conductance at both stations had significant <strong>in</strong>creases which proves to be<br />
an <strong>in</strong>terest<strong>in</strong>g contradiction. Table 5.1 summarizes <strong>the</strong> comparisons <strong>of</strong> each method<br />
with <strong>the</strong>ir respective p-values.<br />
40


