

Statistical Analysis of Trends in the Red River Over a 45 Year Period
Statistical Analysis of Trends in the Red River Over a 45 Year Period
Statistical Analysis of Trends in the Red River Over a 45 Year Period

Create successful ePaper yourself
Turn your PDF publications into a flip-book with our unique Google optimized e-Paper software.
v.1.56. CAS# n/a WQStat Plus TM<br />
BOX & WHISKERS PLOT<br />
150<br />
112<br />
75<br />
37<br />
0<br />
Emerson<br />
912 obs.<br />
Sthfldwy<br />
4 obs.<br />
Selkirk<br />
9 obs.<br />
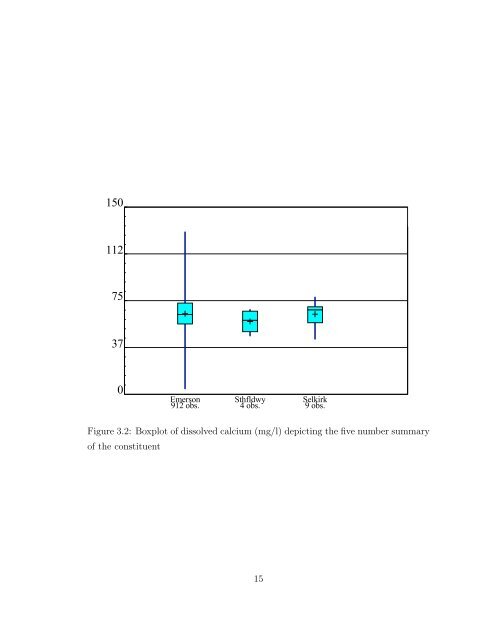
Constituent: Dissolved Calcium (mg/l) Facility: WQTrend<strong>Analysis</strong> Data File: ZZ<br />
Figure Date: 3.2: 6/4/09 Boxplot <strong>of</strong> dissolved calcium (mg/l) Time: depict<strong>in</strong>g 7:49 AM<strong>the</strong> five number View: summary zz<br />
<strong>of</strong> <strong>the</strong> constituent<br />
Create PDF files without this message by purchas<strong>in</strong>g novaPDF pr<strong>in</strong>ter (http://www.novapdf.com)<br />
15


