

Statistical Analysis of Trends in the Red River Over a 45 Year Period
Statistical Analysis of Trends in the Red River Over a 45 Year Period
Statistical Analysis of Trends in the Red River Over a 45 Year Period

You also want an ePaper? Increase the reach of your titles
YUMPU automatically turns print PDFs into web optimized ePapers that Google loves.
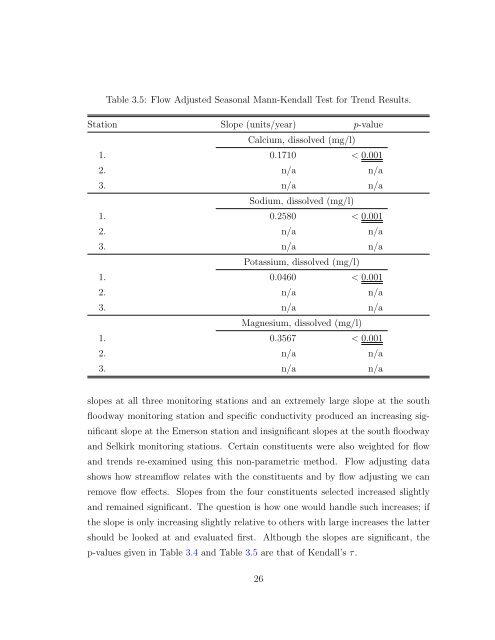
Table 3.5: Flow Adjusted Seasonal Mann-Kendall Test for Trend Results.<br />
Station Slope (units/year) p-value<br />
Calcium, dissolved (mg/l)<br />
1. 0.1710 < 0.001<br />
2. n/a n/a<br />
3. n/a n/a<br />
Sodium, dissolved (mg/l)<br />
1. 0.2580 < 0.001<br />
2. n/a n/a<br />
3. n/a n/a<br />
Potassium, dissolved (mg/l)<br />
1. 0.0460 < 0.001<br />
2. n/a n/a<br />
3. n/a n/a<br />
Magnesium, dissolved (mg/l)<br />
1. 0.3567 < 0.001<br />
2. n/a n/a<br />
3. n/a n/a<br />
slopes at all three monitor<strong>in</strong>g stations and an extremely large slope at <strong>the</strong> south<br />
floodway monitor<strong>in</strong>g station and specific conductivity produced an <strong>in</strong>creas<strong>in</strong>g significant<br />
slope at <strong>the</strong> Emerson station and <strong>in</strong>significant slopes at <strong>the</strong> south floodway<br />
and Selkirk monitor<strong>in</strong>g stations. Certa<strong>in</strong> constituents were also weighted for flow<br />
and trends re-exam<strong>in</strong>ed us<strong>in</strong>g this non-parametric method. Flow adjust<strong>in</strong>g data<br />
shows how streamflow relates with <strong>the</strong> constituents and by flow adjust<strong>in</strong>g we can<br />
remove flow effects. Slopes from <strong>the</strong> four constituents selected <strong>in</strong>creased slightly<br />
and rema<strong>in</strong>ed significant. The question is how one would handle such <strong>in</strong>creases; if<br />
<strong>the</strong> slope is only <strong>in</strong>creas<strong>in</strong>g slightly relative to o<strong>the</strong>rs with large <strong>in</strong>creases <strong>the</strong> latter<br />
should be looked at and evaluated first. Although <strong>the</strong> slopes are significant, <strong>the</strong><br />
p-values given <strong>in</strong> Table 3.4 and Table 3.5 are that <strong>of</strong> Kendall’s τ.<br />
26


