

Statistical Analysis of Trends in the Red River Over a 45 Year Period
Statistical Analysis of Trends in the Red River Over a 45 Year Period
Statistical Analysis of Trends in the Red River Over a 45 Year Period

Create successful ePaper yourself
Turn your PDF publications into a flip-book with our unique Google optimized e-Paper software.
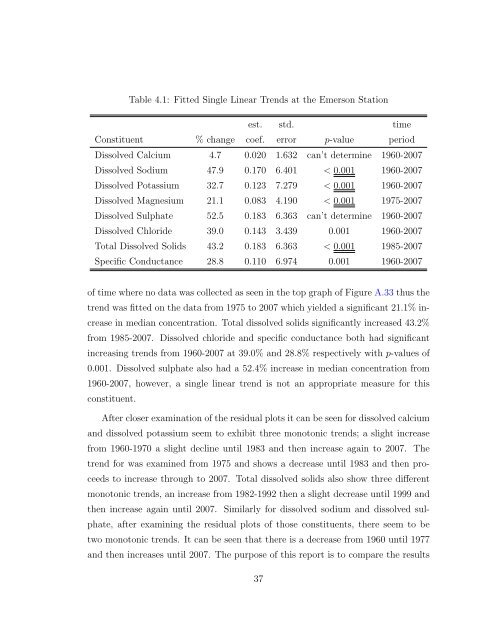
Table 4.1: Fitted S<strong>in</strong>gle L<strong>in</strong>ear <strong>Trends</strong> at <strong>the</strong> Emerson Station<br />
est. std. time<br />
Constituent % change coef. error p-value period<br />
Dissolved Calcium 4.7 0.020 1.632 can’t determ<strong>in</strong>e 1960-2007<br />
Dissolved Sodium 47.9 0.170 6.401 < 0.001 1960-2007<br />
Dissolved Potassium 32.7 0.123 7.279 < 0.001 1960-2007<br />
Dissolved Magnesium 21.1 0.083 4.190 < 0.001 1975-2007<br />
Dissolved Sulphate 52.5 0.183 6.363 can’t determ<strong>in</strong>e 1960-2007<br />
Dissolved Chloride 39.0 0.143 3.439 0.001 1960-2007<br />
Total Dissolved Solids 43.2 0.183 6.363 < 0.001 1985-2007<br />
Specific Conductance 28.8 0.110 6.974 0.001 1960-2007<br />
<strong>of</strong> time where no data was collected as seen <strong>in</strong> <strong>the</strong> top graph <strong>of</strong> Figure A.33 thus <strong>the</strong><br />
trend was fitted on <strong>the</strong> data from 1975 to 2007 which yielded a significant 21.1% <strong>in</strong>crease<br />
<strong>in</strong> median concentration. Total dissolved solids significantly <strong>in</strong>creased 43.2%<br />
from 1985-2007. Dissolved chloride and specific conductance both had significant<br />
<strong>in</strong>creas<strong>in</strong>g trends from 1960-2007 at 39.0% and 28.8% respectively with p-values <strong>of</strong><br />
0.001. Dissolved sulphate also had a 52.4% <strong>in</strong>crease <strong>in</strong> median concentration from<br />
1960-2007, however, a s<strong>in</strong>gle l<strong>in</strong>ear trend is not an appropriate measure for this<br />
constituent.<br />
After closer exam<strong>in</strong>ation <strong>of</strong> <strong>the</strong> residual plots it can be seen for dissolved calcium<br />
and dissolved potassium seem to exhibit three monotonic trends; a slight <strong>in</strong>crease<br />
from 1960-1970 a slight decl<strong>in</strong>e until 1983 and <strong>the</strong>n <strong>in</strong>crease aga<strong>in</strong> to 2007. The<br />
trend for was exam<strong>in</strong>ed from 1975 and shows a decrease until 1983 and <strong>the</strong>n proceeds<br />
to <strong>in</strong>crease through to 2007. Total dissolved solids also show three different<br />
monotonic trends, an <strong>in</strong>crease from 1982-1992 <strong>the</strong>n a slight decrease until 1999 and<br />
<strong>the</strong>n <strong>in</strong>crease aga<strong>in</strong> until 2007. Similarly for dissolved sodium and dissolved sulphate,<br />
after exam<strong>in</strong><strong>in</strong>g <strong>the</strong> residual plots <strong>of</strong> those constituents, <strong>the</strong>re seem to be<br />
two monotonic trends. It can be seen that <strong>the</strong>re is a decrease from 1960 until 1977<br />
and <strong>the</strong>n <strong>in</strong>creases until 2007. The purpose <strong>of</strong> this report is to compare <strong>the</strong> results<br />
37


