

Statistical Analysis of Trends in the Red River Over a 45 Year Period
Statistical Analysis of Trends in the Red River Over a 45 Year Period
Statistical Analysis of Trends in the Red River Over a 45 Year Period

Create successful ePaper yourself
Turn your PDF publications into a flip-book with our unique Google optimized e-Paper software.
v.1.56. CAS# n/a WQStat Plus<br />
BOX & WHISKERS PLOT<br />
TM<br />
Emerson,Sthfldwy,Selkirk<br />
50<br />
37<br />
25<br />
12<br />
0<br />
2/1-3/31<br />
140 obs.<br />
4/1-5/31<br />
179 obs.<br />
6/1-8/31<br />
242 obs.<br />
9/1-1/31<br />
352 obs.<br />
Constituent: Dissolved Potassium (mg/l) Facility: WQTrend<strong>Analysis</strong> Data File: ZZ<br />
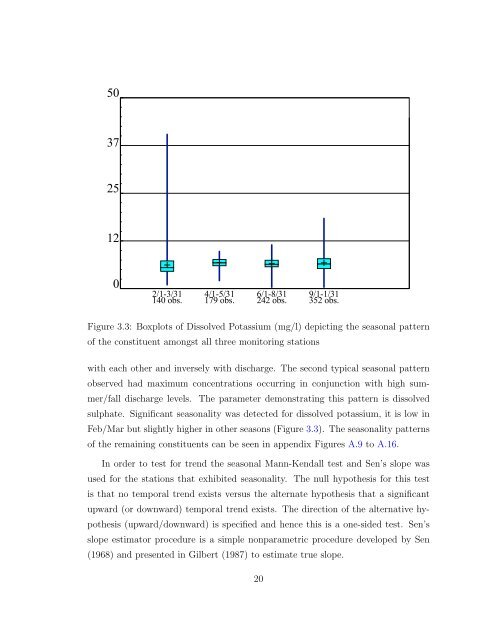
Figure Date: 3.3: 6/4/09 Boxplots <strong>of</strong> Dissolved Potassium Time: (mg/l) 7:54 depict<strong>in</strong>g AM <strong>the</strong> seasonal View: pattern zz<br />
<strong>of</strong> <strong>the</strong> constituent amongst all three monitor<strong>in</strong>g stations<br />
Create PDF files without this message by purchas<strong>in</strong>g novaPDF pr<strong>in</strong>ter (http://www.novapdf.com)<br />
with each o<strong>the</strong>r and <strong>in</strong>versely with discharge. The second typical seasonal pattern<br />
observed had maximum concentrations occurr<strong>in</strong>g <strong>in</strong> conjunction with high summer/fall<br />
discharge levels. The parameter demonstrat<strong>in</strong>g this pattern is dissolved<br />
sulphate. Significant seasonality was detected for dissolved potassium, it is low <strong>in</strong><br />
Feb/Mar but slightly higher <strong>in</strong> o<strong>the</strong>r seasons (Figure 3.3). The seasonality patterns<br />
<strong>of</strong> <strong>the</strong> rema<strong>in</strong><strong>in</strong>g constituents can be seen <strong>in</strong> appendix Figures A.9 to A.16.<br />
In order to test for trend <strong>the</strong> seasonal Mann-Kendall test and Sen’s slope was<br />
used for <strong>the</strong> stations that exhibited seasonality. The null hypo<strong>the</strong>sis for this test<br />
is that no temporal trend exists versus <strong>the</strong> alternate hypo<strong>the</strong>sis that a significant<br />
upward (or downward) temporal trend exists. The direction <strong>of</strong> <strong>the</strong> alternative hypo<strong>the</strong>sis<br />
(upward/downward) is specified and hence this is a one-sided test. Sen’s<br />
slope estimator procedure is a simple nonparametric procedure developed by Sen<br />
(1968) and presented <strong>in</strong> Gilbert (1987) to estimate true slope.<br />
20


