

Statistical Analysis of Trends in the Red River Over a 45 Year Period
Statistical Analysis of Trends in the Red River Over a 45 Year Period
Statistical Analysis of Trends in the Red River Over a 45 Year Period

Create successful ePaper yourself
Turn your PDF publications into a flip-book with our unique Google optimized e-Paper software.
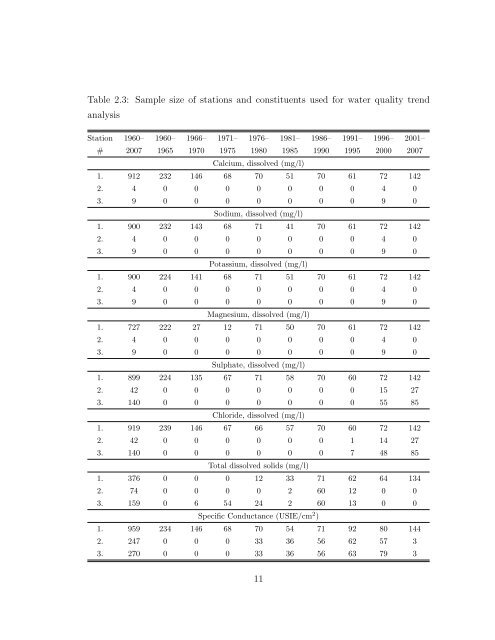
Table 2.3: Sample size <strong>of</strong> stations and constituents used for water quality trend<br />
analysis<br />
Station 1960– 1960– 1966– 1971– 1976– 1981– 1986– 1991– 1996– 2001–<br />
# 2007 1965 1970 1975 1980 1985 1990 1995 2000 2007<br />
Calcium, dissolved (mg/l)<br />
1. 912 232 146 68 70 51 70 61 72 142<br />
2. 4 0 0 0 0 0 0 0 4 0<br />
3. 9 0 0 0 0 0 0 0 9 0<br />
Sodium, dissolved (mg/l)<br />
1. 900 232 143 68 71 41 70 61 72 142<br />
2. 4 0 0 0 0 0 0 0 4 0<br />
3. 9 0 0 0 0 0 0 0 9 0<br />
Potassium, dissolved (mg/l)<br />
1. 900 224 141 68 71 51 70 61 72 142<br />
2. 4 0 0 0 0 0 0 0 4 0<br />
3. 9 0 0 0 0 0 0 0 9 0<br />
Magnesium, dissolved (mg/l)<br />
1. 727 222 27 12 71 50 70 61 72 142<br />
2. 4 0 0 0 0 0 0 0 4 0<br />
3. 9 0 0 0 0 0 0 0 9 0<br />
Sulphate, dissolved (mg/l)<br />
1. 899 224 135 67 71 58 70 60 72 142<br />
2. 42 0 0 0 0 0 0 0 15 27<br />
3. 140 0 0 0 0 0 0 0 55 85<br />
Chloride, dissolved (mg/l)<br />
1. 919 239 146 67 66 57 70 60 72 142<br />
2. 42 0 0 0 0 0 0 1 14 27<br />
3. 140 0 0 0 0 0 0 7 48 85<br />
Total dissolved solids (mg/l)<br />
1. 376 0 0 0 12 33 71 62 64 134<br />
2. 74 0 0 0 0 2 60 12 0 0<br />
3. 159 0 6 54 24 2 60 13 0 0<br />
Specific Conductance (USIE/cm 2 )<br />
1. 959 234 146 68 70 54 71 92 80 144<br />
2. 247 0 0 0 33 36 56 62 57 3<br />
3. 270 0 0 0 33 36 56 63 79 3<br />
11


