Statistical Analysis of Trends in the Red River Over a 45 Year Period
Statistical Analysis of Trends in the Red River Over a 45 Year Period
Statistical Analysis of Trends in the Red River Over a 45 Year Period
You also want an ePaper? Increase the reach of your titles
YUMPU automatically turns print PDFs into web optimized ePapers that Google loves.
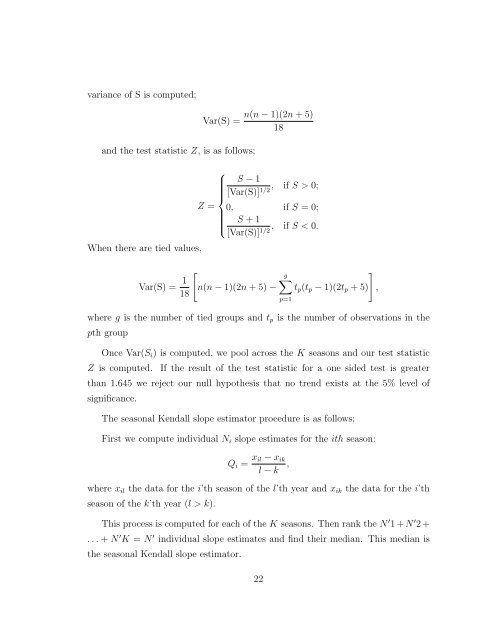
variance <strong>of</strong> S is computed;<br />
Var(S) =<br />
n(n − 1)(2n + 5)<br />
18<br />
and <strong>the</strong> test statistic Z, is as follows;<br />
When <strong>the</strong>re are tied values,<br />
Var(S) = 1 18<br />
[<br />
⎧<br />
S − 1<br />
, if S > 0;<br />
⎪⎨ [Var(S)]<br />
1/2<br />
Z = 0, if S = 0;<br />
S + 1<br />
⎪⎩ , if S < 0.<br />
[Var(S)]<br />
1/2<br />
n(n − 1)(2n + 5) −<br />
]<br />
g∑<br />
t p (t p − 1)(2t p + 5) ,<br />
where g is <strong>the</strong> number <strong>of</strong> tied groups and t p is <strong>the</strong> number <strong>of</strong> observations <strong>in</strong> <strong>the</strong><br />
pth group<br />
Once Var(S i ) is computed, we pool across <strong>the</strong> K seasons and our test statistic<br />
Z is computed.<br />
p=1<br />
If <strong>the</strong> result <strong>of</strong> <strong>the</strong> test statistic for a one sided test is greater<br />
than 1.6<strong>45</strong> we reject our null hypo<strong>the</strong>sis that no trend exists at <strong>the</strong> 5% level <strong>of</strong><br />
significance.<br />
The seasonal Kendall slope estimator procedure is as follows;<br />
First we compute <strong>in</strong>dividual N i slope estimates for <strong>the</strong> ith season:<br />
Q i = x il − x ik<br />
l − k ,<br />
where x il <strong>the</strong> data for <strong>the</strong> i’th season <strong>of</strong> <strong>the</strong> l’th year and x ik <strong>the</strong> data for <strong>the</strong> i’th<br />
season <strong>of</strong> <strong>the</strong> k’th year (l > k).<br />
This process is computed for each <strong>of</strong> <strong>the</strong> K seasons. Then rank <strong>the</strong> N ′ 1 + N ′ 2 +<br />
. . . + N ′ K = N ′ <strong>in</strong>dividual slope estimates and f<strong>in</strong>d <strong>the</strong>ir median. This median is<br />
<strong>the</strong> seasonal Kendall slope estimator.<br />
22


