

Statistical Analysis of Trends in the Red River Over a 45 Year Period
Statistical Analysis of Trends in the Red River Over a 45 Year Period
Statistical Analysis of Trends in the Red River Over a 45 Year Period

Create successful ePaper yourself
Turn your PDF publications into a flip-book with our unique Google optimized e-Paper software.
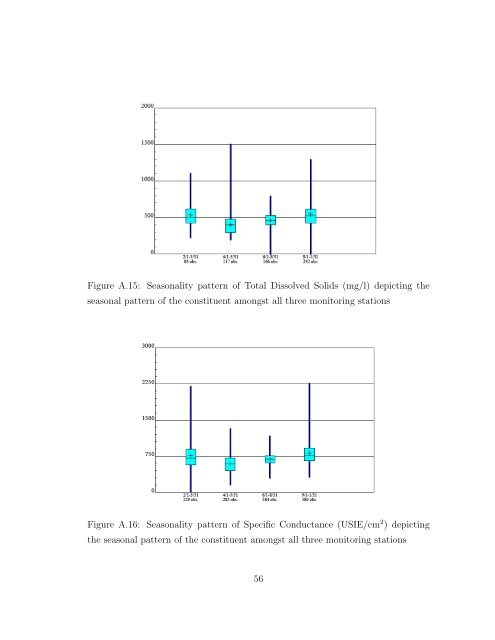
Figure A.15: Seasonality pattern <strong>of</strong> Total Dissolved Solids (mg/l) depict<strong>in</strong>g <strong>the</strong><br />
seasonal pattern <strong>of</strong> <strong>the</strong> constituent amongst all three monitor<strong>in</strong>g stations<br />
Figure A.16: Seasonality pattern <strong>of</strong> Specific Conductance (USIE/cm 2 ) depict<strong>in</strong>g<br />
<strong>the</strong> seasonal pattern <strong>of</strong> <strong>the</strong> constituent amongst all three monitor<strong>in</strong>g stations<br />
56


