Statistical Analysis of Trends in the Red River Over a 45 Year Period
Statistical Analysis of Trends in the Red River Over a 45 Year Period
Statistical Analysis of Trends in the Red River Over a 45 Year Period
Create successful ePaper yourself
Turn your PDF publications into a flip-book with our unique Google optimized e-Paper software.
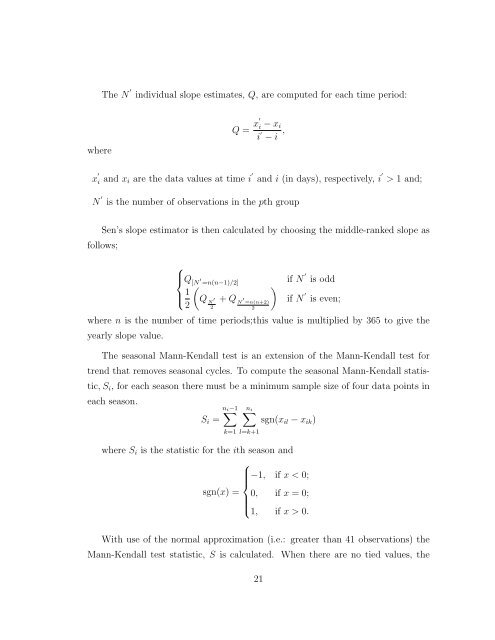
The N ′<br />
<strong>in</strong>dividual slope estimates, Q, are computed for each time period:<br />
where<br />
Q = x′ i − x i<br />
i ′ − i ,<br />
x ′ i and x i are <strong>the</strong> data values at time i ′<br />
and i (<strong>in</strong> days), respectively, i ′ > 1 and;<br />
N ′<br />
is <strong>the</strong> number <strong>of</strong> observations <strong>in</strong> <strong>the</strong> pth group<br />
Sen’s slope estimator is <strong>the</strong>n calculated by choos<strong>in</strong>g <strong>the</strong> middle-ranked slope as<br />
follows;<br />
⎧<br />
⎪⎨ Q [N ′ =n(n−1)/2] if N ′ is odd<br />
(<br />
)<br />
1 ⎪⎩ Q ′<br />
2<br />
N<br />
+ Q ′ N =n(n+2)<br />
if N ′<br />
is even;<br />
2<br />
2<br />
where n is <strong>the</strong> number <strong>of</strong> time periods;this value is multiplied by 365 to give <strong>the</strong><br />
yearly slope value.<br />
The seasonal Mann-Kendall test is an extension <strong>of</strong> <strong>the</strong> Mann-Kendall test for<br />
trend that removes seasonal cycles. To compute <strong>the</strong> seasonal Mann-Kendall statistic,<br />
S i , for each season <strong>the</strong>re must be a m<strong>in</strong>imum sample size <strong>of</strong> four data po<strong>in</strong>ts <strong>in</strong><br />
each season.<br />
S i =<br />
n∑<br />
i −1<br />
∑n i<br />
k=1 l=k+1<br />
sgn(x il − x ik )<br />
where S i is <strong>the</strong> statistic for <strong>the</strong> ith season and<br />
⎧<br />
−1, if x < 0;<br />
⎪⎨<br />
sgn(x) = 0, if x = 0;<br />
⎪⎩<br />
1, if x > 0.<br />
With use <strong>of</strong> <strong>the</strong> normal approximation (i.e.: greater than 41 observations) <strong>the</strong><br />
Mann-Kendall test statistic, S is calculated. When <strong>the</strong>re are no tied values, <strong>the</strong><br />
21


