Environmental Management Accounting Procedures and Principles
Environmental Management Accounting Procedures and Principles
Environmental Management Accounting Procedures and Principles

Create successful ePaper yourself
Turn your PDF publications into a flip-book with our unique Google optimized e-Paper software.
<strong>Environmental</strong> <strong>Management</strong> <strong>Accounting</strong><br />
<strong>Procedures</strong> <strong>and</strong> <strong>Principles</strong><br />
• Share of ton kilometers on railway/ship/truck in percentages;<br />
• Share of passenger kilometers of business trips or means of transport in percentages;<br />
• Share of hazardous waste in relation to total waste production in percentages;<br />
• Recycling rate (share of recycled waste in relation to total waste production in<br />
percentages.)<br />
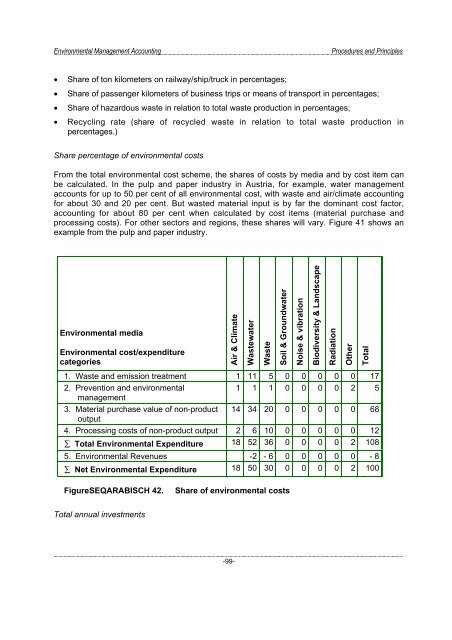
Share percentage of environmental costs<br />
From the total environmental cost scheme, the shares of costs by media <strong>and</strong> by cost item can<br />
be calculated. In the pulp <strong>and</strong> paper industry in Austria, for example, water management<br />
accounts for up to 50 per cent of all environmental cost, with waste <strong>and</strong> air/climate accounting<br />
for about 30 <strong>and</strong> 20 per cent. But wasted material input is by far the dominant cost factor,<br />
accounting for about 80 per cent when calculated by cost items (material purchase <strong>and</strong><br />
processing costs). For other sectors <strong>and</strong> regions, these shares will vary. Figure 41 shows an<br />
example from the pulp <strong>and</strong> paper industry.<br />
<strong>Environmental</strong> media<br />
<strong>Environmental</strong> cost/expenditure<br />
categories<br />
Air & Climate<br />
Wastewater<br />
Waste<br />
Soil & Groundwater<br />
Noise & vibration<br />
Biodiversity & L<strong>and</strong>scape<br />
Radiation<br />
Other<br />
Total<br />
1. Waste <strong>and</strong> emission treatment 1 11 5 0 0 0 0 0 17<br />
2. Prevention <strong>and</strong> environmental<br />
1 1 1 0 0 0 0 2 5<br />
management<br />
3. Material purchase value of non-product 14 34 20 0 0 0 0 0 68<br />
output<br />
4. Processing costs of non-product output 2 6 10 0 0 0 0 0 12<br />
∑ Total <strong>Environmental</strong> Expenditure 18 52 36 0 0 0 0 2 108<br />
5. <strong>Environmental</strong> Revenues -2 - 6 0 0 0 0 0 - 8<br />
∑ Net <strong>Environmental</strong> Expenditure 18 50 30 0 0 0 0 2 100<br />
FigureSEQARABISCH 42.<br />
Share of environmental costs<br />
Total annual investments<br />
-99-