Environmental Management Accounting Procedures and Principles
Environmental Management Accounting Procedures and Principles
Environmental Management Accounting Procedures and Principles

Create successful ePaper yourself
Turn your PDF publications into a flip-book with our unique Google optimized e-Paper software.
<strong>Environmental</strong> <strong>Management</strong> <strong>Accounting</strong><br />
<strong>Procedures</strong> <strong>and</strong> <strong>Principles</strong><br />
Internal environmental costs are often treated as overhead costs <strong>and</strong> divided equally between<br />
all cost drivers. A common example is that the costs of treating toxic waste of a product are<br />
included in the general overhead costs, <strong>and</strong> the overhead is allocated in equal parts to all<br />
products.<br />
However, “dirty” products cause more emissions <strong>and</strong> require more clean-up facilities than<br />
“clean” products. Equal allocation of those costs therefore subsidizes environmentally more<br />
harmful products. The clean products, on the other h<strong>and</strong>, are “penalized” by this allocation rule<br />
as they bear costs that they did not cause.<br />
Many companies simply include all environmental protection costs in their general overhead<br />
costs, together with the top management salaries, advertising costs <strong>and</strong> all other costs that<br />
were not traced back to individual production processes. At a time when environmental<br />
compliance costs were marginal <strong>and</strong> profits high, this might have been reasonable. But with<br />
increased environmental awareness, strong competition <strong>and</strong> the need to improve production<br />
efficiency, especially with regard to material efficiency, the cost of tracking <strong>and</strong> tracing material<br />
flows throughout the company are by far outweighed by the improvement potentials identified<br />
<strong>and</strong> realized.<br />
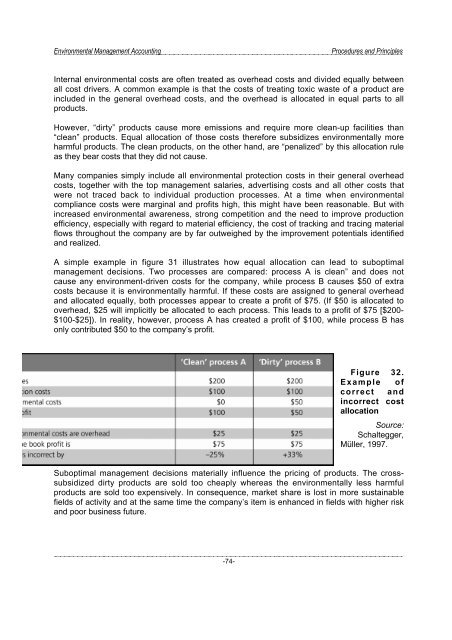
A simple example in figure 31 illustrates how equal allocation can lead to suboptimal<br />
management decisions. Two processes are compared: process A is clean” <strong>and</strong> does not<br />
cause any environment-driven costs for the company, while process B causes $50 of extra<br />
costs because it is environmentally harmful. If these costs are assigned to general overhead<br />
<strong>and</strong> allocated equally, both processes appear to create a profit of $75. (If $50 is allocated to<br />
overhead, $25 will implicitly be allocated to each process. This leads to a profit of $75 [$200-<br />
$100-$25]). In reality, however, process A has created a profit of $100, while process B has<br />
only contributed $50 to the company’s profit.<br />
Figure 32.<br />
Example of<br />
correct <strong>and</strong><br />
incorrect cost<br />
allocation<br />
Source:<br />
Schaltegger,<br />
Müller, 1997.<br />
Suboptimal management decisions materially influence the pricing of products. The crosssubsidized<br />
dirty products are sold too cheaply whereas the environmentally less harmful<br />
products are sold too expensively. In consequence, market share is lost in more sustainable<br />
fields of activity <strong>and</strong> at the same time the company’s item is enhanced in fields with higher risk<br />
<strong>and</strong> poor business future.<br />
-74-