- Page 1 and 2: OFFERING MEMORANDUM—LISTING PARTI
- Page 3 and 4: IMPORTANT INFORMATION This Offering
- Page 5 and 6: NOTICE TO EEA INVESTORS This Offeri
- Page 7 and 8: NOTES ON DEFINED TERMS USED IN THIS
- Page 9 and 10: PRESENTATION OF FINANCIAL AND OTHER
- Page 11 and 12: The 2007 Pro Forma Financial Inform
- Page 13 and 14: EXCHANGE RATES Exchange Rate Betwee
- Page 15 and 16: Exchange Rate Between the Euro and
- Page 17 and 18: Exchange Rate Between the Euro and
- Page 19 and 20: Ardagh Glass Engineering Ardagh Gla
- Page 21 and 22: • Continue to Apply Advanced Tech
- Page 23 and 24: As at September 30, 2009, after giv
- Page 25 and 26: • be effectively subordinated to
- Page 27: Use of Proceeds ................ Tr
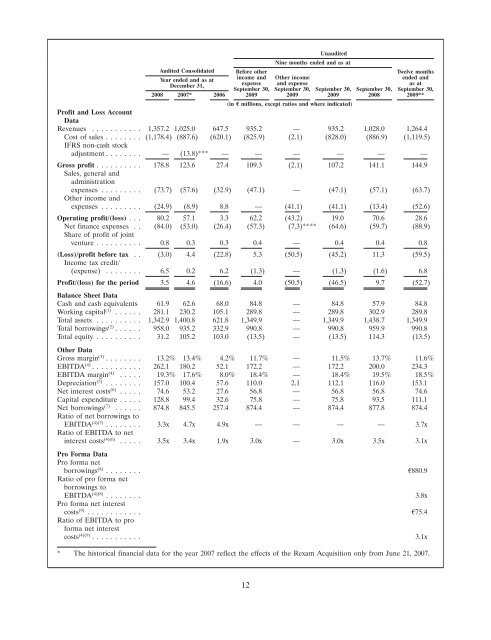
- Page 31 and 32: The reconciliation of operating pro
- Page 33 and 34: Our credit facilities contain finan
- Page 35 and 36: Facility, causing all the debt unde
- Page 37 and 38: An active trading market may not de
- Page 39 and 40: its hedging arrangements. As at Sep
- Page 41 and 42: • issued such Guarantee in a situ
- Page 43 and 44: will continue to be preferred by ou
- Page 45 and 46: We are subject to various environme
- Page 47 and 48: Changes in laws and regulations rel
- Page 49 and 50: the twelve months ended September 3
- Page 51 and 52: Coulson is Chairman of the board of
- Page 53 and 54: CAPITALIZATION The following table
- Page 55 and 56: Unaudited Nine months ended and as
- Page 57 and 58: UNAUDITED SUPPLEMENTAL INFORMATION
- Page 59 and 60: OPERATING AND FINANCIAL REVIEW AND
- Page 61 and 62: Acquisition of Busch and Spreen. In
- Page 63 and 64: Goodwill Goodwill represents the ex
- Page 65 and 66: Operating Profit Excluding other in
- Page 67 and 68: Audited Pro forma Year ended Decemb
- Page 69 and 70: major drivers of the rise in gross
- Page 71 and 72: Operating Results The significant i
- Page 73 and 74: Historical Development The followin
- Page 75 and 76: External Financings The following t
- Page 77 and 78: Derivative transactions are only un
- Page 79 and 80:
Beverages, Diageo, and Nestlé. Ard
- Page 81 and 82:
has consistently focused on decreas
- Page 83 and 84:
The following table shows certain p
- Page 85 and 86:
Ardagh Glass Engineering Ardagh’s
- Page 87 and 88:
Key competitors by material type: P
- Page 89 and 90:
period. This agreement supersedes a
- Page 91 and 92:
Intellectual Property Glass Contain
- Page 93 and 94:
Asbestos is present, or may be pres
- Page 95 and 96:
facilities are well maintained and
- Page 97 and 98:
glass container industry. Heye Inte
- Page 99 and 100:
Board of Directors The following ta
- Page 101 and 102:
Internal Control and Risk Managemen
- Page 103 and 104:
DESCRIPTION OF OTHER INDEBTEDNESS T
- Page 105 and 106:
Under the Intercreditor Agreement,
- Page 107 and 108:
In addition, certain negative coven
- Page 109 and 110:
DESCRIPTION OF THE NOTES The defini
- Page 111 and 112:
(b) rank senior in right of payment
- Page 113 and 114:
etain Permitted Junior Securities a
- Page 115 and 116:
under the Guarantee would cause the
- Page 117 and 118:
of its Subsidiaries may act as payi
- Page 119 and 120:
to obtain such receipts, the same a
- Page 121 and 122:
the Issuer would be obligated to pa
- Page 123 and 124:
of Control could cause a default un
- Page 125 and 126:
or otherwise become responsible for
- Page 127 and 128:
principal amount that may be drawn
- Page 129 and 130:
Payment (or, if such aggregate cumu
- Page 131 and 132:
indirectly, to issue or sell, any s
- Page 133 and 134:
directly secured by a Lien on such
- Page 135 and 136:
Notwithstanding the foregoing, noth
- Page 137 and 138:
(e) encumbrances or restrictions co
- Page 139 and 140:
(ii) maintain or preserve such Pers
- Page 141 and 142:
Guarantor would dispose of, all or
- Page 143 and 144:
periods and other than by regularly
- Page 145 and 146:
(b) the Issuer’s obligations to i
- Page 147 and 148:
occurring after an Event of Default
- Page 149 and 150:
Indenture, the Notes or any Guarant
- Page 151 and 152:
‘‘Asset Sale’’ means any sa
- Page 153 and 154:
a share of the profits and losses,
- Page 155 and 156:
‘‘Consolidated Fixed Charge Cov
- Page 157 and 158:
Notwithstanding any of the foregoin
- Page 159 and 160:
otherwise require any cash payment
- Page 161 and 162:
or other property to others or any
- Page 163 and 164:
(f) Investments in the Notes and th
- Page 165 and 166:
(l) Liens arising by reason of any
- Page 167 and 168:
or associated with, any Asset Sale,
- Page 169 and 170:
elevant security agent in the enfor
- Page 171 and 172:
BOOK-ENTRY; DELIVERY AND FORM Gener
- Page 173 and 174:
The Global Note for Rule 144A Book-
- Page 175 and 176:
TAXATION Prospective purchasers of
- Page 177 and 178:
Encashment Tax If the Paying Agent
- Page 179 and 180:
Interest on the Senior Notes Paymen
- Page 181 and 182:
will hold Senior Notes as part of a
- Page 183 and 184:
amount of OID into U.S. dollars and
- Page 185 and 186:
LIMITATIONS ON VALIDITY AND ENFORCE
- Page 187 and 188:
Effect of Appointment of Examiner T
- Page 189 and 190:
Liability Company as General Partne
- Page 191 and 192:
of court by the company, its direct
- Page 193 and 194:
court). As a general rule, such leg
- Page 195 and 196:
which creditors have a right to be
- Page 197 and 198:
ascertain the center of main intere
- Page 199 and 200:
Italy Ardagh Glass S.r.l., one of t
- Page 201 and 202:
Fraudulent Transfer Provisions of G
- Page 203 and 204:
provided that no such offer of Seni
- Page 205 and 206:
NOTICE TO INVESTORS The Senior Note
- Page 207 and 208:
AND ANY APPLICABLE LOCAL LAWS AND R
- Page 209 and 210:
(ii) the process and decision of th
- Page 211 and 212:
In cases of non-compliance with or
- Page 213 and 214:
Recognition of Judgments in Civil a
- Page 215 and 216:
LISTING AND GENERAL INFORMATION 1.
- Page 217 and 218:
15. The consolidated non-statutory
- Page 219 and 220:
Place of Registration and Registrat
- Page 221 and 222:
Place of Registration and Registrat
- Page 223 and 224:
CONSOLIDATED NON-STATUTORY FINANCIA
- Page 225 and 226:
STATEMENT OF DIRECTORS’ RESPONSIB
- Page 227 and 228:
BASIS OF PREPARATION (Continued) su
- Page 229 and 230:
BASIS OF PREPARATION (Continued) In
- Page 231 and 232:
ACCOUNTING POLICIES (Continued) (v)
- Page 233 and 234:
ACCOUNTING POLICIES (Continued) INV
- Page 235 and 236:
ACCOUNTING POLICIES (Continued) to
- Page 237 and 238:
ACCOUNTING POLICIES (Continued) fin
- Page 239 and 240:
ACCOUNTING POLICIES (Continued) (ii
- Page 241 and 242:
CONSOLIDATED INCOME STATEMENT FOR T
- Page 243 and 244:
CONSOLIDATED BALANCE SHEET AS AT 31
- Page 245 and 246:
NOTES TO THE CONSOLIDATED FINANCIAL
- Page 247 and 248:
NOTES TO THE CONSOLIDATED FINANCIAL
- Page 249 and 250:
NOTES TO THE CONSOLIDATED FINANCIAL
- Page 251 and 252:
NOTES TO THE CONSOLIDATED FINANCIAL
- Page 253 and 254:
NOTES TO THE CONSOLIDATED FINANCIAL
- Page 255 and 256:
NOTES TO THE CONSOLIDATED FINANCIAL
- Page 257 and 258:
NOTES TO THE CONSOLIDATED FINANCIAL
- Page 259 and 260:
NOTES TO THE CONSOLIDATED FINANCIAL
- Page 261 and 262:
NOTES TO THE CONSOLIDATED FINANCIAL
- Page 263 and 264:
NOTES TO THE CONSOLIDATED FINANCIAL
- Page 265 and 266:
NOTES TO THE CONSOLIDATED FINANCIAL
- Page 267 and 268:
NOTES TO THE CONSOLIDATED FINANCIAL
- Page 269 and 270:
NOTES TO THE CONSOLIDATED FINANCIAL
- Page 271 and 272:
NOTES TO THE CONSOLIDATED FINANCIAL
- Page 273 and 274:
NOTES TO THE CONSOLIDATED FINANCIAL
- Page 275 and 276:
NOTES TO THE CONSOLIDATED FINANCIAL
- Page 277 and 278:
NOTES TO THE CONSOLIDATED FINANCIAL
- Page 279 and 280:
NOTES TO THE CONSOLIDATED FINANCIAL
- Page 281 and 282:
INDEPENDENT AUDITORS’ REPORT TO T
- Page 283 and 284:
BASIS OF PREPARATION These consolid
- Page 285 and 286:
BASIS OF PREPARATION (Continued) Ar
- Page 287 and 288:
ACCOUNTING POLICIES (Continued) (v)
- Page 289 and 290:
ACCOUNTING POLICIES (Continued) Sub
- Page 291 and 292:
ACCOUNTING POLICIES (Continued) car
- Page 293 and 294:
ACCOUNTING POLICIES (Continued) The
- Page 295 and 296:
ACCOUNTING POLICIES (Continued) bal
- Page 297 and 298:
CONSOLIDATED INCOME STATEMENT FOR T
- Page 299 and 300:
CONSOLIDATED BALANCE SHEET AS AT 31
- Page 301 and 302:
NOTES TO THE CONSOLIDATED FINANCIAL
- Page 303 and 304:
NOTES TO THE CONSOLIDATED FINANCIAL
- Page 305 and 306:
NOTES TO THE CONSOLIDATED FINANCIAL
- Page 307 and 308:
NOTES TO THE CONSOLIDATED FINANCIAL
- Page 309 and 310:
NOTES TO THE CONSOLIDATED FINANCIAL
- Page 311 and 312:
NOTES TO THE CONSOLIDATED FINANCIAL
- Page 313 and 314:
NOTES TO THE CONSOLIDATED FINANCIAL
- Page 315 and 316:
NOTES TO THE CONSOLIDATED FINANCIAL
- Page 317 and 318:
NOTES TO THE CONSOLIDATED FINANCIAL
- Page 319 and 320:
NOTES TO THE CONSOLIDATED FINANCIAL
- Page 321 and 322:
NOTES TO THE CONSOLIDATED FINANCIAL
- Page 323 and 324:
NOTES TO THE CONSOLIDATED FINANCIAL
- Page 325 and 326:
NOTES TO THE CONSOLIDATED FINANCIAL
- Page 327 and 328:
NOTES TO THE CONSOLIDATED FINANCIAL
- Page 329 and 330:
NOTES TO THE CONSOLIDATED FINANCIAL
- Page 331 and 332:
NOTES TO THE CONSOLIDATED FINANCIAL
- Page 333 and 334:
NOTES TO THE CONSOLIDATED FINANCIAL
- Page 335 and 336:
INTERIM UNAUDITED NON-STATUTORY GRO
- Page 337 and 338:
CONSOLIDATED INTERIM INCOME STATEME
- Page 339 and 340:
CONSOLIDATED INTERIM BALANCE SHEET
- Page 341 and 342:
NOTES TO THE UNAUDITED CONSOLIDATED
- Page 343 and 344:
NOTES TO THE UNAUDITED CONSOLIDATED
- Page 345 and 346:
NOTES TO THE UNAUDITED CONSOLIDATED
- Page 347 and 348:
NOTES TO THE UNAUDITED CONSOLIDATED
- Page 349 and 350:
ISSUER Ardagh Glass Finance plc 4 R
- Page 351:
F180,000,000 Ardagh Glass Finance p


