Chapter A - Introduction - City of Pickering
Chapter A - Introduction - City of Pickering
Chapter A - Introduction - City of Pickering
Create successful ePaper yourself
Turn your PDF publications into a flip-book with our unique Google optimized e-Paper software.
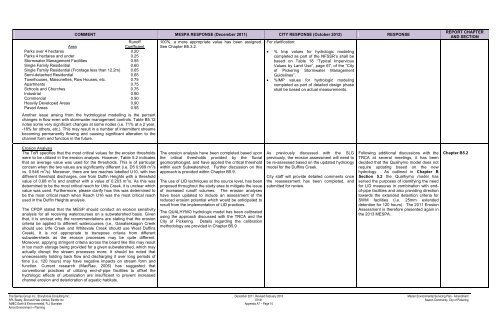
Area<br />
Parks over 4 hectares<br />
Parks 4 hectares and under<br />
Stormwater Management Facilities<br />
Single Family Residential<br />
Single Family Residential (Frontage less than 12.2m)<br />
Semi-detached Residential<br />
Townhouses, Maisonettes, Row Houses, etc.<br />
Apartments<br />
Schools and Churches<br />
Industrial<br />
Commercial<br />
Heavily Developed Areas<br />
Paved Areas<br />
COMMENT MESPA RESPONSE (December 2011) CITY RESPONSE (October 2012) RESPONSE<br />
Run<strong>of</strong>f<br />
Coefficient<br />
0.20<br />
0.25<br />
0.55<br />
0.60<br />
0.65<br />
0.65<br />
0.75<br />
0.75<br />
0.75<br />
0.90<br />
0.90<br />
0.90<br />
0.95<br />
Another issue arising from the hydrological modelling is the percent<br />
changes in flow even with stormwater management controls. Table B5.12<br />
notes some very significant changes at some nodes (i.e. 71% at a 2 year,<br />
-18% for others, etc.). This may result in a number <strong>of</strong> intermittent streams<br />
becoming permanently flowing and causing significant alteration to the<br />
channel form and function in the future.<br />
100%, a more appropriate value has been assigned.<br />
See <strong>Chapter</strong> B5.3.2.<br />
For clarification:<br />
• % Imp values for hydrologic modeling<br />
completed as part <strong>of</strong> the NFSSR’s shall be<br />
based on Table 18 “Typical Impervious<br />
Values by Land Use”, page 67, <strong>of</strong> the “<strong>City</strong><br />
<strong>of</strong> <strong>Pickering</strong> Stormwater Management<br />
Guidelines”.<br />
• %IMP values for hydrologic modeling<br />
completed as part <strong>of</strong> detailed design phase<br />
shall be based on actual measurements.<br />
REPORT CHAPTER<br />
AND SECTION<br />
Erosion Analysis<br />
The ToR specifies that the most critical values for the erosion thresholds<br />
were to be utilized in the erosion analysis. However, Table 5.2 indicates<br />
that an average value was used for the thresholds. This is <strong>of</strong> particular<br />
concern when the two values are significantly different (i.e. D5 0.909 m 3 /s<br />
vs. 0.546 m 3 /s). Moreover, there are two reaches labelled U10, with two<br />
different threshold discharges, one from Duffin Heights with a threshold<br />
value <strong>of</strong> 0.68 m 3 /s and another with a value <strong>of</strong> 0.203 m 3 /s. As this was<br />
determined to be the most critical reach for Urfe Creek, it is unclear which<br />
value was used. Furthermore, please clarify how this was determined to<br />
be the most critical reach when Reach U16 was the most critical reach<br />
used in the Duffin Heights analysis.<br />
The CPDP stated that the MESP should conduct an erosion sensitivity<br />
analysis for all receiving watercourses on a subwatershed basis. Given<br />
that, it is unclear why the recommendations are stating that the erosion<br />
criteria be applied to different watercourses (i.e., Ganatsekiagon Creek<br />
should use Urfe Creek and Whitevale Creek should use West Duffins<br />
Creek). It is not appropriate to transpose criteria from different<br />
subwatersheds as the erosion processes may be quite different.<br />
Moreover, applying stringent criteria across the board like this may result<br />
in too much storage being provided for a given subwatershed, which may<br />
actually disrupt the stream processes more. It should be noted that<br />
unnecessarily holding back flow and discharging it over long periods <strong>of</strong><br />
time (i.e. 120 hours) may have negative impacts on stream form and<br />
function. Current research (MacRae, 2006) has suggested that<br />
conventional practices <strong>of</strong> utilizing end-<strong>of</strong>-pipe facilities to <strong>of</strong>fset the<br />
hydrologic effects <strong>of</strong> urbanization are insufficient to prevent increased<br />
channel erosion and deterioration <strong>of</strong> aquatic habitats.<br />
The erosion analysis have been completed based upon<br />
the critical thresholds provided by the fluvial<br />
geomorphologist, and have applied the critical threshold<br />
within each Subwatershed. Further discussion on this<br />
approach is provided within <strong>Chapter</strong> B5.9.<br />
The use <strong>of</strong> LID techniques at the source level, has been<br />
proposed throughout the study area to mitigate the issue<br />
<strong>of</strong> increased run<strong>of</strong>f volumes. The erosion analyses<br />
have been updated to include an assessment <strong>of</strong> the<br />
reduced erosion potential which would be anticipated to<br />
result from the implementation <strong>of</strong> LID practices.<br />
The QUALHYMO hydrologic model has been calibrated<br />
using the approach discussed with the TRCA and the<br />
<strong>City</strong> <strong>of</strong> <strong>Pickering</strong>. Details regarding the calibration<br />
methodology are provided in <strong>Chapter</strong> B5.9<br />
As previously discussed with the SLG<br />
previously, the erosion assessment will need to<br />
be re-assessed based on the updated hydrology<br />
model for the Duffins Creek.<br />
<strong>City</strong> staff will provide detailed comments once<br />
the reassessment has been completed, and<br />
submitted for review.<br />
Following additional discussions with the<br />
TRCA at several meetings, it has been<br />
decided that the Qualhymo model does not<br />
require updating based on the new<br />
hydrology. As outlined in <strong>Chapter</strong> B<br />
Section 5.2 the Qualhymo model has<br />
served the purposes <strong>of</strong> identifying the need<br />
for LID measures in combination with end<strong>of</strong>-pipe<br />
facilities and also providing direction<br />
towards the extended detention criteria for<br />
SWM facilities (i.e. 25mm extended<br />
detention for 120 hours). The 2011 Erosion<br />
Assessment is therefore presented again in<br />
the 2013 MESPA.<br />
<strong>Chapter</strong> B5.2<br />
The Sernas Group Inc., Stonybrook Consulting Inc. December 2011, Revised February 2013 Master Environmental Servicing Plan - Amendment<br />
SPL Beatty, Bird and Hale Limited, Earthfx Inc. 07161 Seaton Community, <strong>City</strong> <strong>of</strong> <strong>Pickering</strong><br />
AMEC Earth & Environmental, R.J. Burnside Appendix A7 – Page 10<br />
Amos Environment + Planning


