Refresher Training for Frontline Health Workers in Expanded ... - RHO
Refresher Training for Frontline Health Workers in Expanded ... - RHO
Refresher Training for Frontline Health Workers in Expanded ... - RHO

Create successful ePaper yourself
Turn your PDF publications into a flip-book with our unique Google optimized e-Paper software.
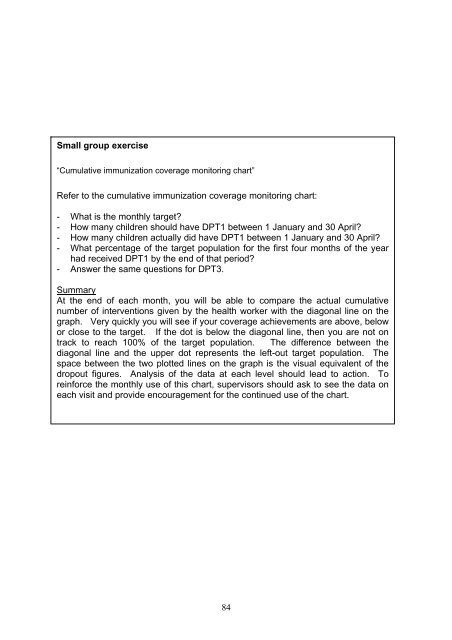
Small group exercise<br />
“Cumulative immunization coverage monitor<strong>in</strong>g chart”<br />
Refer to the cumulative immunization coverage monitor<strong>in</strong>g chart:<br />
- What is the monthly target?<br />
- How many children should have DPT1 between 1 January and 30 April?<br />
- How many children actually did have DPT1 between 1 January and 30 April?<br />
- What percentage of the target population <strong>for</strong> the first four months of the year<br />
had received DPT1 by the end of that period?<br />
- Answer the same questions <strong>for</strong> DPT3.<br />
Summary<br />
At the end of each month, you will be able to compare the actual cumulative<br />
number of <strong>in</strong>terventions given by the health worker with the diagonal l<strong>in</strong>e on the<br />
graph. Very quickly you will see if your coverage achievements are above, below<br />
or close to the target. If the dot is below the diagonal l<strong>in</strong>e, then you are not on<br />
track to reach 100% of the target population. The difference between the<br />
diagonal l<strong>in</strong>e and the upper dot represents the left-out target population. The<br />
space between the two plotted l<strong>in</strong>es on the graph is the visual equivalent of the<br />
dropout figures. Analysis of the data at each level should lead to action. To<br />
re<strong>in</strong><strong>for</strong>ce the monthly use of this chart, supervisors should ask to see the data on<br />
each visit and provide encouragement <strong>for</strong> the cont<strong>in</strong>ued use of the chart.<br />
84