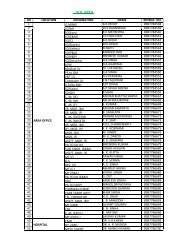
Year : 2010-11 - CCL
Year : 2010-11 - CCL
Year : 2010-11 - CCL

Create successful ePaper yourself
Turn your PDF publications into a flip-book with our unique Google optimized e-Paper software.
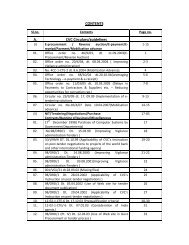
__________________________________________________ CENTRAL COALFIELDS LIMITED<br />
IMPORTANT FINANCIAL INFORMATION & RELATIVE RATIOS<br />
(A) FINANCIAL INFORMATION<br />
( in lakh)<br />
<strong>Year</strong> Ending 31st March 20<strong>11</strong> <strong>2010</strong> 2009 2008 2007 2006 2005 2004 2003 2002<br />
(A) Related to Assets & Liabilities :<br />
(1) Shareholders’ Fund :<br />
(a) Equity 94000.00 94000.00 94000.00 94000.00 94000.00 94000.00 94000.00 94000.00 94000.00 94000.00<br />
(b) Reserve & Surplus 79217.87 58046.80 40554.00 32580.00 22228.00 <strong>11</strong>650.00 0.00 0.00 0.00 0.00<br />
(c) Profit/Loss (+)/(–) 130582.91 <strong>11</strong>4017.16 80128.60 62037.20 52399.82 26597.52 -4363.37 -38224.88 –71810.67 –<strong>11</strong>0275.63<br />
(d) Deferred Liabilities 0.00 0.00 0.00 0.00 0.00 0.00 0.00 0.00 0.00 0.00<br />
Net Worth 303800.78 266063.96 214682.60 188617.20 168627.82 132247.52 89636.63 55775.12 22189.33 –16275.63<br />
(2) Loan 10492.50 <strong>11</strong>205.41 29397.58 42287.77 58312.80 89593.76 105870.10 129880.52 166861.19 166526.21<br />
(3) Capital Employed 224070.57 186582.88 149849.22 156671.51 170346.23 168624.77 129476.22 143737.78 165595.60 128181.72<br />
(4) (i) Net Fixed Assets 143247.79 151618.81 144689.88 139571.27 141508.12 134050.64 134375.06 140236.77 149268.86 161464.05<br />
(ii) Current Assets 663969.56 566643.75 627013.45 488491.56 369686.23 344354.68 224630.16 151535.20 152033.03 152134.28<br />
(iii) Net Current Assets (W/C) 80822.78 34964.07 5159.34 17100.24 28838.<strong>11</strong> 34574.13 -4898.84 3674.00 16551.25 –32977.03<br />
(5) Current Liabilities<br />
(Excl. intt. accrued & due) 583146.78 531679.68 621854.<strong>11</strong> 471391.32 340848.12 309780.55 229529.00 147861.20 135481.78 185<strong>11</strong>1.31<br />
(6) (a) Sundry Debtors (Net) 94164.02 51244.83 74526.48 54130.98 47217.31 6<strong>11</strong>06.59 65984.02 64922.68 66868.30 62846.16<br />
(b) Cash & Bank 258276.90 260700.75 181588.39 <strong>11</strong>1546.67 33408.78 23482.02 184<strong>11</strong>.43 <strong>11</strong>155.59 16552.79 <strong>11</strong>906.16<br />
(7) Closing Stock of :<br />
(a) Stores & Spares (Net) 14356.30 15478.88 14199.42 12987.48 12793.06 13518.08 14517.65 14635.70 14870.14 15273.48<br />
(b) Coal & Cokes etc. (Net) 129231.21 100637.81 80626.38 85803.88 68268.19 57881.77 44268.74 33505.73 25986.34 27151.21<br />
(c) Other Inventories (Net) <strong>11</strong><strong>11</strong>.93 1600.84 1980.52 326.58 302.26 184.70 1799.90 1942.71 1755.30 1592.21<br />
(8) Average Stock of Stores & Spares (Net) 15097.12 14839.15 13593.45 12890.27 13155.57 14017.87 14576.68 14752.92 15071.81 16387.56<br />
(B) Related to Profit/Loss :<br />
(1) (a) Gross Margin 208003.97 175849.02 99939.36 133814.08 130437.34 158869.92 73966.61 68229.21 72610.01 26332.45<br />
(b) Gross Profit 186917.18 155043.81 80731.44 109950.21 <strong>11</strong>0948.55 126296.44 54743.15 49028.62 51754.73 5158.51<br />
(c) Net Profit (Before Tax &<br />
Invest Allowance etc.) 186021.68 153305.01 76380.39 103524.51 102030.39 <strong>11</strong>6498.01 43781.45 37038.44 38464.96 –10831.57<br />
(2) (a) Gross Sales 708313.08 629192.03 597837.36 506054.49 450640.99 451290.55 404373.49 348852.20 333440.55 274284.54<br />
(b) Net Sales (after levies &<br />
Dev. etc.) 604169.96 548822.42 521088.78 436294.37 390072.61 391000.70 3492<strong>11</strong>.69 295578.70 285552.27 236178.52<br />
(c) Paid/Payable Amount of<br />
Royality, Cess etc. 104143.12 80369.61 76748.58 69760.12 60568.38 60289.85 55161.80 53273.50 47888.28 38106.02<br />
(d) Avg. Net Sales per Month 50347.50 45735.20 43424.07 36357.86 32506.05 32583.39 29100.97 24631.56 23796.02 19681.54<br />
(3) Cost of Goods Sold (Sales–Profit) 418148.28 395517.41 444708.39 332769.86 288042.22 274502.69 305430.24 258540.26 247087.31 247010.09<br />
(4) (a) Toal Expenditure<br />
(Excl. Recov. & others) 620618.43 571660.47 588016.70 490781.13 443132.18 417215.92 442183.53 379521.00 354686.98 348944.59<br />
(b) Salary & Wages (Gross Rev. only) 257625.05 236002.64 262128.61 179989.52 145<strong>11</strong>6.06 13<strong>11</strong>85.86 170694.50 135013.00 <strong>11</strong>5340.93 <strong>11</strong>9016.49<br />
(c) Stores & Spares (Gross Rev. only) 53322.23 50717.83 48491.42 48834.51 42417.96 44107.38 42354.04 39346.21 35968.93 33662.30<br />
(d) Power & Fuel 20674.27 26689.97 25628.66 22595.23 22651.97 21952.80 2<strong>11</strong>51.64 20<strong>11</strong>0.88 19798.73 19624.33<br />
(e) Int. & Depreciations (Gross rev. only) 21982.29 22544.01 23558.97 30289.57 28406.95 42371.91 30185.16 3<strong>11</strong>90.77 34145.05 37164.02<br />
(5) Avg. Consump. of Stores & Spares<br />
(Gross) per month 4443.52 4226.49 4040.95 4069.54 3534.83 3675.62 3529.50 3278.85 2997.41 2805.19<br />
(6) (a) Avg. Manpower Employed<br />
during the year 53171 55305 57681 60209 62905 65536 68335 7<strong>11</strong>00 73664 76405<br />
(b) Social Overhead (incl. LTC/LLTC) 23360.43 20292.92 19300.53 16527.31 14360.09 <strong>11</strong>977.50 <strong>11</strong>645.39 <strong>11</strong>546.92 10654.60 <strong>11</strong>317.66<br />
(c) Social O.H. expnd./employees<br />
( ’000) 43.93 36.69 33.46 27.45 22.83 18.28 17.04 16.24 14.46 14.81<br />
(7) (a) Value Added 558748.33 488140.19 440578.19 379326.60 333270.84 339809.50 298247.67 243701.16 231915.77 189864.35<br />
(b) Value Added per employee<br />
( ‘000) 1050.85 882.63 763.83 630.02 529.80 518.51 436.45 342.76 314.83 248.50<br />
9