Year : 2010-11 - CCL
Year : 2010-11 - CCL
Year : 2010-11 - CCL

Create successful ePaper yourself
Turn your PDF publications into a flip-book with our unique Google optimized e-Paper software.
ANNUAL REPORT <strong>2010</strong>-<strong>11</strong> ________________________________________________________<br />
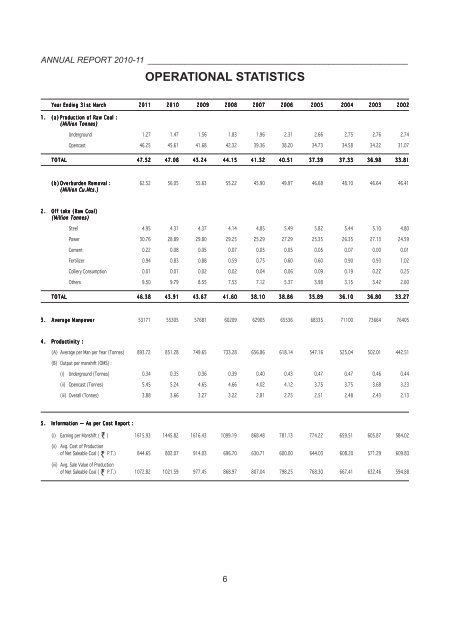
OPERATIONAL STATISTICS<br />
<strong>Year</strong> Ending 31st March 20<strong>11</strong> <strong>2010</strong> 2009 2008 2007 2006 2005 2004 2003 2002<br />
1. (a) Production of Raw Coal :<br />
(Million Tonnes)<br />
Underground 1.27 1.47 1.56 1.83 1.96 2.31 2.66 2.75 2.76 2.74<br />
Opencast 46.25 45.61 41.68 42.32 39.36 38.20 34.73 34.58 34.22 31.07<br />
TOTAL 47.52 47.08 43.24 44.15 41.32 40.51 37.39 37.33 36.98 33.81<br />
(b) Overburden Removal : 62.52 56.05 55.63 55.22 45.90 49.97 46.68 48.10 46.64 46.41<br />
(Million Cu.Mts.)<br />
2. Off take (Raw Coal)<br />
(Million Tonnes)<br />
Steel 4.95 4.31 4.37 4.14 4.85 5.49 5.82 5.44 5.10 4.80<br />
Power 30.76 28.89 29.80 29.25 25.29 27.29 25.35 26.35 27.13 24.59<br />
Cement 0.22 0.08 0.05 0.07 0.05 0.05 0.05 0.07 0.00 0.01<br />
Fertilizer 0.94 0.83 0.88 0.59 0.75 0.60 0.60 0.90 0.93 1.02<br />
Colliery Consumption 0.01 0.01 0.02 0.02 0.04 0.06 0.09 0.19 0.22 0.25<br />
Others 9.50 9.79 8.55 7.53 7.12 5.37 3.98 3.15 3.42 2.60<br />
TOTAL 46.38 43.91 43.67 41.60 38.10 38.86 35.89 36.10 36.80 33.27<br />
3. Average Manpower 53171 55305 57681 60209 62905 65536 68335 7<strong>11</strong>00 73664 76405<br />
4. Productivity :<br />
(A) Average per Man per <strong>Year</strong> (Tonnes) 893.72 851.28 749.65 733.28 656.86 618.14 547.16 525.04 502.01 442.51<br />
(B) Output per manshift (OMS) :<br />
(i) Underground (Tonnes) 0.34 0.35 0.36 0.39 0.40 0.43 0.47 0.47 0.46 0.44<br />
(ii) Opencast (Tonnes) 5.45 5.24 4.65 4.66 4.02 4.12 3.75 3.75 3.68 3.23<br />
(iii) Overall (Tonnes) 3.88 3.66 3.27 3.22 2.81 2.75 2.51 2.48 2.43 2.13<br />
5. Information — As per Cost Report :<br />
(i) Earning per Manshift ( ) 1615.93 1445.82 1616.43 1099.19 868.48 781.13 774.22 659.51 605.87 584.02<br />
(ii) Avg. Cost of Production<br />
of Net Saleable Coal ( P.T.) 844.65 802.07 914.03 696.70 630.71 600.00 644.03 608.20 571.29 609.83<br />
(iii) Avg. Sale Value of Production<br />
of Net Saleable Coal ( P.T.) 1072.82 1021.59 977.45 868.97 807.04 798.25 768.30 667.41 632.46 594.88<br />
6