Comprehensive Annual Financial Report - St. Tammany Parish ...
Comprehensive Annual Financial Report - St. Tammany Parish ...
Comprehensive Annual Financial Report - St. Tammany Parish ...

Create successful ePaper yourself
Turn your PDF publications into a flip-book with our unique Google optimized e-Paper software.
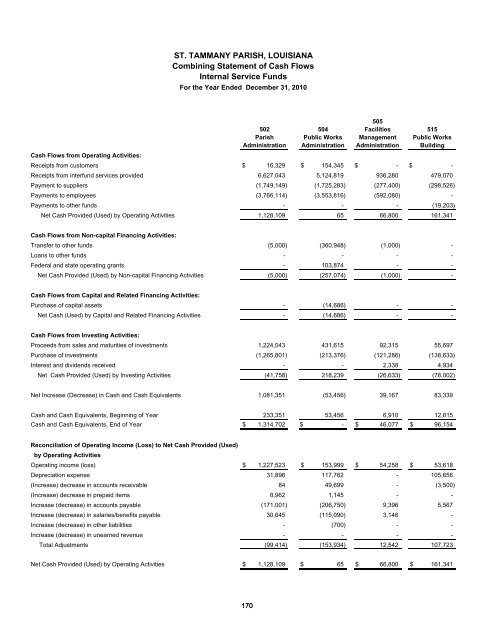
ST. TAMMANY PARISH, LOUISIANA<br />
Combining <strong>St</strong>atement of Cash Flows<br />
Internal Service Funds<br />
For the Year Ended December 31, 2010<br />
502<br />
<strong>Parish</strong><br />
Administration<br />
504<br />
Public Works<br />
Administration<br />
505<br />
Facilities<br />
Management<br />
Administration<br />
515<br />
Public Works<br />
Building<br />
Cash Flows from Operating Activities:<br />
Receipts from customers $ 16,329 $ 154,345 $ - $<br />
-<br />
Receipts from interfund services provided 6,627,043 5,124,819 936,280 479,070<br />
Payment to suppliers (1,749,149) (1,725,283) (277,400) (298,526)<br />
Payments to employees (3,766,114) (3,553,816) (592,080) -<br />
Payments to other funds - - - (19,203)<br />
Net Cash Provided (Used) by Operating Activities 1,128,109 65 66,800 161,341<br />
Cash Flows from Non-capital Financing Activities:<br />
Transfer to other funds (5,000) (360,948) (1,000) -<br />
Loans to other funds - - - -<br />
Federal and state operating grants - 103,874 - -<br />
Net Cash Provided (Used) by Non-capital Financing Activities (5,000) (257,074) (1,000) -<br />
Cash Flows from Capital and Related Financing Activities:<br />
Purchase of capital assets - (14,686) - -<br />
Net Cash (Used) by Capital and Related Financing Activities - (14,686) - -<br />
Cash Flows from Investing Activities:<br />
Proceeds from sales and maturities of investments 1,224,043 431,615 92,315 55,697<br />
Purchase of investments (1,265,801) (213,376) (121,286) (138,633)<br />
Interest and dividends received - - 2,338 4,934<br />
Net Cash Provided (Used) by Investing Activities (41,758) 218,239 (26,633) (78,002)<br />
Net Increase (Decrease) in Cash and Cash Equivalents 1,081,351 (53,456) 39,167 83,339<br />
Cash and Cash Equivalents, Beginning of Year 233,351 53,456 6,910 12,815<br />
Cash and Cash Equivalents, End of Year $ 1,314,702 $ - $ 46,077 $ 96,154<br />
Reconciliation of Operating Income (Loss) to Net Cash Provided (Used)<br />
by Operating Activities<br />
Operating income (loss) $ 1,227,523 $ 153,999 $ 54,258 $ 53,618<br />
Depreciation expense 31,896 117,762 - 105,656<br />
(Increase) decrease in accounts receivable 84 49,699 - (3,500)<br />
(Increase) decrease in prepaid items 8,962 1,145 - -<br />
Increase (decrease) in accounts payable (171,001) (206,750) 9,396 5,567<br />
Increase (decrease) in salaries/benefits payable 30,645 (115,090) 3,146 -<br />
Increase (decrease) in other liabilities - (700) - -<br />
Increase (decrease) in unearned revenue - - - -<br />
Total Adjustments (99,414) (153,934) 12,542 107,723<br />
Net Cash Provided (Used) by Operating Activities $ 1,128,109 $ 65 $ 66,800 $ 161,341<br />
170