SCHEDULE 18 continued 520 <strong>St</strong>. <strong>Tammany</strong> <strong>Parish</strong> Slidell Administrative Complex 522 OEP Building 523 Wellness Center 524 Courthouse Annex 525 <strong>St</strong>. <strong>Tammany</strong> <strong>Parish</strong> Hwy 59 Administrative Complex 527 Engineering Building 530 Archive Management $ - $ 147,147 $ - $ 15,441 $ - $ - $ - 442,697 421,174 97,500 75,335 468,627 269,662 134,998 (133,635) (343,976) (68,123) (49,910) (281,394) (151,192) (55,949) (96,474) (42,764) - - - - (116,663) (18,508) (25,274) (3,940) (3,692) (19,225) (10,826) - 194,080 156,307 25,437 37,174 168,008 107,644 (37,614) - - - - - - - - - - - - - - - - - - - - - - - - - - - - (69,870) - - - - - (13,114) (69,870) - - - - - (13,114) 233,043 133,273 82,713 31,071 158,459 30,922 145,612 (248,480) (181,454) (84,878) (38,988) (177,791) (91,569) (30,572) 17,180 8,705 2,384 2,519 13,708 2,671 8,537 1,743 (39,476) 219 (5,398) (5,624) (57,976) 123,577 125,953 116,831 25,656 31,776 162,384 49,668 72,849 101,048 24,003 6,017 6,989 37,587 6,643 22,052 $ 227,001 $ 140,834 $ 31,673 $ 38,765 $ 199,971 $ 56,311 $ 94,901 $ 74,374 $ (131,321) $ 1,286 $ 36,493 $ 72,601 $ 73,692 $ (44,262) 30,642 252,680 23,245 4,500 86,757 31,265 8,643 - - - - - - - (99) (228) - - (5) - - 88,621 36,589 906 (2,528) 8,655 2,687 (2,614) 542 231 - - - - 619 - - - - - - - - (1,644) - (1,291) - - - 119,706 287,628 24,151 681 95,407 33,952 6,648 $ 194,080 $ 156,307 $ 25,437 $ 37,174 $ 168,008 $ 107,644 $ (37,614) 171
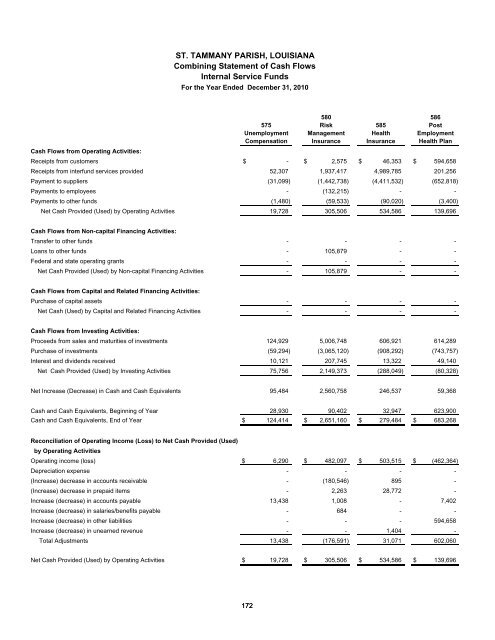
ST. TAMMANY PARISH, LOUISIANA Combining <strong>St</strong>atement of Cash Flows Internal Service Funds For the Year Ended December 31, 2010 575 Unemployment Compensation 580 Risk Management Insurance 585 Health Insurance 586 Post Employment Health Plan Cash Flows from Operating Activities: Receipts from customers $ - $ 2,575 $ 46,353 $ 594,658 Receipts from interfund services provided 52,307 1,937,417 4,989,785 201,256 Payment to suppliers (31,099) (1,442,738) (4,411,532) (652,818) Payments to employees - (132,215) - - Payments to other funds (1,480) (59,533) (90,020) (3,400) Net Cash Provided (Used) by Operating Activities 19,728 305,506 534,586 139,696 Cash Flows from Non-capital Financing Activities: Transfer to other funds - - - - Loans to other funds - 105,879 - - Federal and state operating grants - - - - Net Cash Provided (Used) by Non-capital Financing Activities - 105,879 - - Cash Flows from Capital and Related Financing Activities: Purchase of capital assets - - - - Net Cash (Used) by Capital and Related Financing Activities - - - - Cash Flows from Investing Activities: iti Proceeds from sales and maturities of investments 124,929 5,006,748 606,921 614,289 Purchase of investments (59,294) (3,065,120) (908,292) (743,757) Interest and dividends received 10,121 207,745 13,322 49,140 Net Cash Provided (Used) by Investing Activities 75,756 2,149,373 (288,049) (80,328) Net Increase (Decrease) in Cash and Cash Equivalents 95,484 2,560,758 246,537 59,368 Cash and Cash Equivalents, Beginning of Year 28,930 90,402 32,947 623,900 Cash and Cash Equivalents, End of Year $ 124,414 $ 2,651,160 $ 279,484 $ 683,268 Reconciliation of Operating Income (Loss) to Net Cash Provided (Used) by Operating Activities Operating income (loss) $ 6,290 $ 482,097 $ 503,515 $ (462,364) Depreciation expense - - - - (Increase) decrease in accounts receivable - (180,546) 895 - (Increase) decrease in prepaid items - 2,263 28,772 - Increase (decrease) in accounts payable 13,438 1,008 - 7,402 Increase (decrease) in salaries/benefits payable - 684 - - Increase (decrease) in other liabilities - - - 594,658 Increase (decrease) in unearned revenue - - 1,404 - Total Adjustments 13,438 (176,591) 31,071 602,060 Net Cash Provided (Used) by Operating Activities $ 19,728 $ 305,506 $ 534,586 $ 139,696 172
- Page 1 and 2:
Comprehensive Annual Financial Repo
- Page 4 and 5:
ST. TAMMANY PARISH GOVERNMENT COMPR
- Page 6:
Schedule of Compensation Paid to Co
- Page 10 and 11:
St. Tammany Parish Department of Fi
- Page 12 and 13:
months of 2010. This increase was n
- Page 15 and 16:
ST. TAMMANY PARISH EXECUTIVE BRANCH
- Page 17 and 18:
ST. TAMMANY PARISH GOVERNMENT PRINC
- Page 20 and 21:
LAPORTE SEHRT ROMIG HAND CERTIfiED
- Page 22 and 23:
Management’s Discussion and Analy
- Page 24 and 25:
The Parish adopts annual appropriat
- Page 26 and 27:
At the end of the current fiscal ye
- Page 28 and 29:
Expenses and Program Revenues - Gov
- Page 30 and 31:
sales tax revenue stabilizes so tha
- Page 32 and 33:
Additional information on St. Tamma
- Page 34:
BASIC FINANCIAL STATEMENTS 27
- Page 37 and 38:
ST. TAMMANY PARISH, LOUISIANA State
- Page 39 and 40:
ST. TAMMANY PARISH, LOUISIANA Balan
- Page 41 and 42:
ST. TAMMANY PARISH, LOUISIANA State
- Page 43 and 44:
ST. TAMMANY PARISH, LOUISIANA Recon
- Page 45:
STATEMENT G ST. TAMMANY PARISH, LOU
- Page 48 and 49:
SCHEDULE H (continued) ST. TAMMANY
- Page 50 and 51:
STATEMENT I Recreation District No.
- Page 52:
STATEMENT J Fire Protection Distric
- Page 55 and 56:
ST. TAMMANY PARISH GOVERNMENT Notes
- Page 57 and 58:
ST. TAMMANY PARISH GOVERNMENT Notes
- Page 59 and 60:
ST. TAMMANY PARISH GOVERNMENT Notes
- Page 61 and 62:
ST. TAMMANY PARISH GOVERNMENT Notes
- Page 63 and 64:
ST. TAMMANY PARISH GOVERNMENT Notes
- Page 65 and 66:
The details of this $2,123,937 diff
- Page 67 and 68:
ST. TAMMANY PARISH GOVERNMENT Notes
- Page 69 and 70:
ST. TAMMANY PARISH GOVERNMENT Notes
- Page 71 and 72:
ST. TAMMANY PARISH GOVERNMENT Notes
- Page 73 and 74:
ST. TAMMANY PARISH GOVERNMENT Notes
- Page 75 and 76:
ST. TAMMANY PARISH GOVERNMENT Notes
- Page 77 and 78:
ST. TAMMANY PARISH GOVERNMENT Notes
- Page 79 and 80:
ST. TAMMANY PARISH GOVERNMENT Notes
- Page 81 and 82:
ST. TAMMANY PARISH GOVERNMENT Notes
- Page 83 and 84:
ST. TAMMANY PARISH GOVERNMENT Notes
- Page 85 and 86:
ST. TAMMANY PARISH GOVERNMENT Notes
- Page 87 and 88:
ST. TAMMANY PARISH GOVERNMENT Notes
- Page 89 and 90:
ST. TAMMANY PARISH, LOUISIANA Sched
- Page 91 and 92:
ST. TAMMANY PARISH, LOUISIANA Sched
- Page 93 and 94:
ST. TAMMANY PARISH, LOUISIANA Sched
- Page 96 and 97:
NOTES TO REQUIRED SUPPLEMENTARY INF
- Page 98:
SCHEDULE 7 Public Safety Health and
- Page 101 and 102:
ST. TAMMANY PARISH, LOUISIANA Combi
- Page 104 and 105:
NON-MAJOR SPECIAL REVENUE FUNDS Spe
- Page 106 and 107:
NON-MAJOR SPECIAL REVENUE FUNDS (Co
- Page 108 and 109:
SCHEDULE 10 continued 020 Environme
- Page 110 and 111:
SCHEDULE 10 continued 164 Lighting
- Page 112 and 113:
SCHEDULE 10 continued 401 Grants -
- Page 114 and 115:
SCHEDULE 10 continued 440 Grants -
- Page 116 and 117:
SCHEDULE 11 continued Final Budget
- Page 118 and 119:
SCHEDULE 11 continued Final Budget
- Page 120 and 121:
SCHEDULE 11 continued Final Budget
- Page 122 and 123:
SCHEDULE 11 continued 166 167 169 L
- Page 124 and 125:
SCHEDULE 11 continued 174 175 176 L
- Page 126 and 127:
SCHEDULE 11 continued 402 403 404 G
- Page 128 and 129: SCHEDULE 11 continued 416 418 420 G
- Page 130 and 131: SCHEDULE 11 continued Final Budget
- Page 132 and 133: NON-MAJOR DEBT SERVICE FUNDS Debt S
- Page 134 and 135: SCHEDULE 12 237 Justice Complex Deb
- Page 136 and 137: SCHEDULE 13 continued 233 234 237 L
- Page 138 and 139: SCHEDULE 13 continued 249 Total Non
- Page 140 and 141: NON-MAJOR CAPITAL PROJECTS FUNDS Ca
- Page 142 and 143: NON-MAJOR CAPITAL PROJECTS FUNDS (C
- Page 144 and 145: SCHEDULE 14 continued 305 Capital S
- Page 146 and 147: SCHEDULE 14 continued 320 GIS Capit
- Page 148 and 149: SCHEDULE 14 continued 333 Parish Li
- Page 150 and 151: SCHEDULE 15 continued ST. TAMMANY P
- Page 152 and 153: SCHEDULE 15 continued 305 306 307 C
- Page 154 and 155: SCHEDULE 15 continued 310 311 312 C
- Page 156 and 157: SCHEDULE 15 continued 316 320 321 C
- Page 158 and 159: SCHEDULE 15 continued 324 325 326 D
- Page 160 and 161: SCHEDULE 15 continued Final Budget
- Page 162 and 163: SCHEDULE 15 continued Final Budget
- Page 164 and 165: SCHEDULE 15 continued Final Budget
- Page 166 and 167: INTERNAL SERVICE FUNDS Internal Ser
- Page 168 and 169: 161
- Page 170 and 171: SCHEDULE 16 continued 520 St. Tamma
- Page 172 and 173: SCHEDULE 16 continued 587 Post Empl
- Page 174 and 175: SCHEDULE 17 continued 520 St. Tamma
- Page 176 and 177: SCHEDULE 17 continued 586 Post Empl
- Page 180 and 181: SCHEDULE 18 continued 587 Post Empl
- Page 182 and 183: NON-MAJOR COMPONENT UNITS 175
- Page 184 and 185: SCHEDULE 19 continued Fire Protecti
- Page 186 and 187: SCHEDULE 19 continued Recreation Di
- Page 188 and 189: SCHEDULE 19 continued Sub-Drainage
- Page 190 and 191: SCHEDULE 20 continued Drainage Dist
- Page 192 and 193: SCHEDULE 20 continued Net (Expenses
- Page 194 and 195: SCHEDULE 20 continued Gravity Drain
- Page 196 and 197: BUDGETARY COMPARISONS 189
- Page 198 and 199: ST. TAMMANY PARISH, LOUISIANA Sched
- Page 200 and 201: OTHER SUPPLEMENTARY INFORMATION 193
- Page 202 and 203: SCHEDULE 24 ST. TAMMANY PARISH, LOU
- Page 204 and 205: SCHEDULE 25 335 TOTAL Sub-Drainage
- Page 206 and 207: ST. TAMMANY PARISH, LOUISIANA Sched
- Page 208 and 209: ST. TAMMANY PARISH GOVERNMENT Capit
- Page 210 and 211: ST. TAMMANY PARISH GOVERNMENT Capit
- Page 212 and 213: ST. TAMMANY PARISH GOVERNMENT Capit
- Page 214 and 215: ST. TAMMANY PARISH GOVERNMENT Capit
- Page 216 and 217: ST. TAMMANY PARISH GOVERNMENT Capit
- Page 218 and 219: ST. TAMMANY PARISH GOVERNMENT Capit
- Page 220 and 221: ST. TAMMANY PARISH GOVERNMENT Capit
- Page 222 and 223: ST. TAMMANY PARISH, LOUISIANA Detai
- Page 224 and 225: ST. TAMMANY PARISH, LOUISIANA Debt
- Page 226 and 227: ST. TAMMANY PARISH, LOUISIANA Debt
- Page 228 and 229:
ST. TAMMANY PARISH, LOUISIANA Sched
- Page 230 and 231:
STATISTICAL SECTION (UNAUDITED) Thi
- Page 232 and 233:
TABLE 1 2007 2006 2005 2004 2003 $
- Page 234 and 235:
General Revenues and Other Changes
- Page 236 and 237:
TABLE 3 Fiscal Year 2006 2005 2004
- Page 238 and 239:
TABLE 4 Fiscal Year 2007 2006 2005
- Page 240 and 241:
ST. TAMMANY PARISH, LOUISIANA TAX R
- Page 242 and 243:
ST. TAMMANY PARISH, LOUISIANA PRINC
- Page 244 and 245:
ST. TAMMANY PARISH, LOUISIANA DIREC
- Page 246 and 247:
ST. TAMMANY PARISH GOVERNMENT, LOUI
- Page 248 and 249:
ST. TAMMANY PARISH, LOUISIANA RATIO
- Page 250 and 251:
ST. TAMMANY PARISH GOVERNMENT TABLE
- Page 252 and 253:
ST. TAMMANY PARISH, GOVERNMENT DEMO
- Page 254 and 255:
TABLE 18 ST. TAMMANY PARISH, LOUISI
- Page 256 and 257:
TABLE 19 2006 2005 2004 2003 2002 2
- Page 258 and 259:
SINGLE AUDIT SECTION 251
- Page 260 and 261:
LAPORTE SEHRT ROMIG HAND CERTIFlED
- Page 262 and 263:
LAPORTE SEHRT ROMIG HAND CERTIFIED
- Page 264 and 265:
ST. TAMMANY PARISH, LOUISIANA SCHED
- Page 266 and 267:
ST. TAMMANY PARISH, LOUISIANA SCHED
- Page 268 and 269:
(Accrued) Unearned (Accrued) Unearn
- Page 270 and 271:
St. Tammany Parish Department of Fi