Comprehensive Annual Financial Report - St. Tammany Parish ...
Comprehensive Annual Financial Report - St. Tammany Parish ...
Comprehensive Annual Financial Report - St. Tammany Parish ...

Create successful ePaper yourself
Turn your PDF publications into a flip-book with our unique Google optimized e-Paper software.
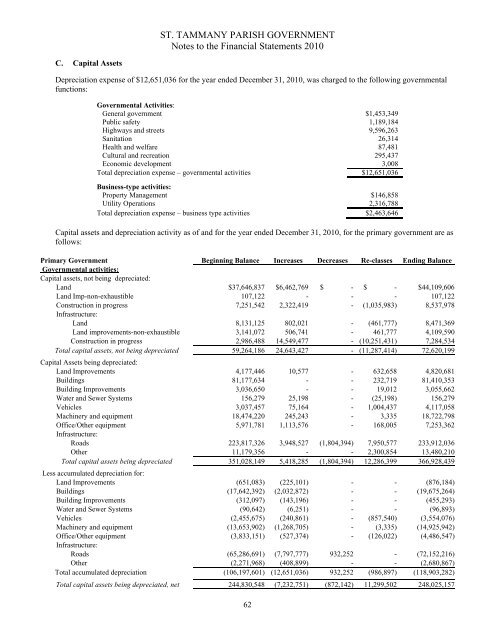
ST. TAMMANY PARISH GOVERNMENT<br />
Notes to the <strong>Financial</strong> <strong>St</strong>atements 2010<br />
C. Capital Assets<br />
Depreciation expense of $12,651,036 for the year ended December 31, 2010, was charged to the following governmental<br />
functions:<br />
Governmental Activities:<br />
General government $1,453,349<br />
Public safety 1,189,184<br />
Highways and streets 9,596,263<br />
Sanitation 26,314<br />
Health and welfare 87,481<br />
Cultural and recreation 295,437<br />
Economic development 3,008<br />
Total depreciation expense – governmental activities $12,651,036<br />
Business-type activities:<br />
Property Management $146,858<br />
Utility Operations 2,316,788<br />
Total depreciation expense – business type activities $2,463,646<br />
Capital assets and depreciation activity as of and for the year ended December 31, 2010, for the primary government are as<br />
follows:<br />
Primary Government Beginning Balance Increases Decreases Re-classes Ending Balance<br />
Governmental activities:<br />
Capital assets, not being depreciated:<br />
Land $37,646,837 $6,462,769 $ - $ - $44,109,606<br />
Land Imp-non-exhaustible 107,122 - - - 107,122<br />
Construction in progress 7,251,542 2,322,419 - (1,035,983) 8,537,978<br />
Infrastructure:<br />
Land 8,131,125 802,021 - (461,777) 8,471,369<br />
Land improvements-non-exhaustible 3,141,072 506,741 - 461,777 4,109,590<br />
Construction in progress 2,986,488 14,549,477 - (10,251,431) 7,284,534<br />
Total capital assets, not being depreciated 59,264,186 24,643,427 - (11,287,414) 72,620,199<br />
Capital Assets being depreciated:<br />
Land Improvements 4,177,446 10,577 - 632,658 4,820,681<br />
Buildings 81,177,634 - - 232,719 81,410,353<br />
Building Improvements 3,036,650 - - 19,012 3,055,662<br />
Water and Sewer Systems 156,279 25,198 - (25,198) 156,279<br />
Vehicles 3,037,457 75,164 - 1,004,437 4,117,058<br />
Machinery and equipment 18,474,220 245,243 - 3,335 18,722,798<br />
Office/Other equipment 5,971,781 1,113,576 - 168,005 7,253,362<br />
Infrastructure:<br />
Roads 223,817,326 3,948,527 (1,804,394) 7,950,577 233,912,036<br />
Other 11,179,356 - - 2,300,854 13,480,210<br />
Total capital assets being depreciated 351,028,149 5,418,285 (1,804,394) 12,286,399 366,928,439<br />
Less accumulated depreciation for:<br />
Land Improvements (651,083) (225,101) - - (876,184)<br />
Buildings (17,642,392) (2,032,872) - - (19,675,264)<br />
Building Improvements (312,097) (143,196) - - (455,293)<br />
Water and Sewer Systems (90,642) (6,251) - - (96,893)<br />
Vehicles (2,455,675) (240,861) - (857,540) (3,554,076)<br />
Machinery and equipment (13,653,902) (1,268,705) - (3,335) (14,925,942)<br />
Office/Other equipment (3,833,151) (527,374) - (126,022) (4,486,547)<br />
Infrastructure:<br />
Roads (65,286,691) (7,797,777) 932,252 - (72,152,216)<br />
Other (2,271,968) (408,899) - - (2,680,867)<br />
Total accumulated depreciation (106,197,601) (12,651,036) 932,252 (986,897) (118,903,282)<br />
Total capital assets being depreciated, net 244,830,548 (7,232,751) (872,142) 11,299,502 248,025,157<br />
62