Comprehensive Annual Financial Report - St. Tammany Parish ...
Comprehensive Annual Financial Report - St. Tammany Parish ...
Comprehensive Annual Financial Report - St. Tammany Parish ...

Create successful ePaper yourself
Turn your PDF publications into a flip-book with our unique Google optimized e-Paper software.
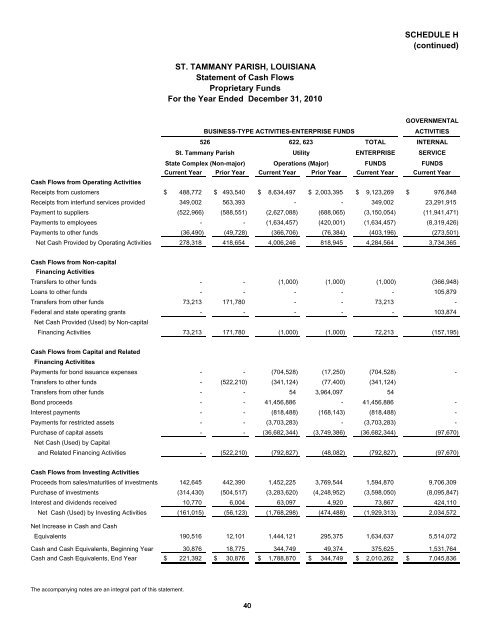
SCHEDULE H<br />
(continued)<br />
ST. TAMMANY PARISH, LOUISIANA<br />
<strong>St</strong>atement of Cash Flows<br />
Proprietary Funds<br />
For the Year Ended December 31, 2010<br />
BUSINESS-TYPE ACTIVITIES-ENTERPRISE FUNDS<br />
GOVERNMENTAL<br />
ACTIVITIES<br />
526 622, 623 TOTAL INTERNAL<br />
<strong>St</strong>. <strong>Tammany</strong> <strong>Parish</strong> Utility ENTERPRISE SERVICE<br />
<strong>St</strong>ate Complex (Non-major) Operations (Major) FUNDS FUNDS<br />
Current Year Prior Year Current Year Prior Year Current Year Current Year<br />
Cash Flows from Operating Activities<br />
Receipts from customers $ 488,772 $ 493,540 $ 8,634,497 $ 2,003,395 $ 9,123,269 $ 976,848<br />
Receipts from interfund services provided 349,002 563,393 - - 349,002 23,291,915<br />
Payment to suppliers (522,966) (588,551) (2,627,088) (688,065) (3,150,054) (11,941,471)<br />
Payments to employees - - (1,634,457) (420,001) (1,634,457) (8,319,426)<br />
Payments to other funds (36,490) (49,728) (366,706) (76,384) (403,196) (273,501)<br />
Net Cash Provided by Operating Activities 278,318 418,654 4,006,246 818,945 4,284,564 3,734,365<br />
Cash Flows from Non-capital<br />
Financing Activities<br />
Transfers to other funds - - (1,000) (1,000) (1,000) (366,948)<br />
Loans to other funds - - - - - 105,879<br />
Transfers from other funds 73,213 171,780 - - 73,213 -<br />
Federal and state operating grants - - - - - 103,874<br />
Net Cash Provided (Used) by Non-capital<br />
Financing Activities 73,213 171,780 (1,000) (1,000) 72,213 (157,195)<br />
Cash Flows from Capital and Related<br />
Financing Activitites<br />
Payments for bond issuance expenses - - (704,528) (17,250) (704,528) -<br />
Transfers to other funds - (522,210) (341,124) (77,400) (341,124)<br />
Transfers from other funds - - 54 3,964,097 54<br />
Bond proceeds - - 41,456,886 - 41,456,886 -<br />
Interest payments - - (818,488) (168,143) (818,488) -<br />
Payments for restricted assets - - (3,703,283) - (3,703,283) -<br />
Purchase of capital assets - - (36,682,344) (3,749,386) (36,682,344) (97,670)<br />
Net Cash (Used) by Capital<br />
and Related Financing Activities - (522,210) (792,827) (48,082) (792,827) (97,670)<br />
Cash Flows from Investing Activities<br />
Proceeds from sales/maturities of investments 142,645 442,390 1,452,225 3,769,544 1,594,870 9,706,309<br />
Purchase of investments (314,430) (504,517) (3,283,620) (4,248,952) (3,598,050) (8,095,847)<br />
Interest and dividends received 10,770 6,004 63,097 4,920 73,867 424,110<br />
Net Cash (Used) by Investing Activities (161,015) (56,123) (1,768,298) (474,488) (1,929,313) 2,034,572<br />
Net Increase in Cash and Cash<br />
Equivalents 190,516 12,101 1,444,121 295,375 1,634,637 5,514,072<br />
Cash and Cash Equivalents, Beginning Year 30,876 18,775 344,749 49,374 375,625 1,531,764<br />
Cash and Cash Equivalents, End Year $ 221,392 $ 30,876 $ 1,788,870 $ 344,749 $ 2,010,262 $ 7,045,836<br />
The accompanying notes are an integral part of this statement.<br />
40