- Page 1 and 2:
IMPACT OF HOST PLANT XYLEM FLUID ON
- Page 3 and 4:
0.18 600 Optical density 0.16 0.14
- Page 5 and 6:
OPTIMIZING MARKER-ASSISTED SELECTIO
- Page 7 and 8:
esistant and susceptible genotypes
- Page 9 and 10:
MAP BASED IDENTIFICATION AND POSITI
- Page 11 and 12:
esistant genotypes are in process a
- Page 13 and 14:
BREEDING PIERCE’S DISEASE RESISTA
- Page 15 and 16:
Progeny from crosses of field resis
- Page 17 and 18:
a = (1=low, 4= high); b = (1=green,
- Page 19 and 20:
- 78 -
- Page 21 and 22:
- 80 -
- Page 23 and 24:
v.8) for differences due to the pla
- Page 25 and 26:
SHARPSHOOTER FEEDING BEHAVIOR IN RE
- Page 27 and 28:
correlated with all other findings
- Page 29 and 30:
EFFECTS OF FEEDING SUBSTRATE ON RET
- Page 31 and 32:
REFERENCES Bextine, B. and T. Mille
- Page 33 and 34:
will also provide insights into the
- Page 35 and 36:
OBJECTIVES 1. Determine glassy-wing
- Page 37 and 38:
GWSS per 30 s sweep (seasonal avera
- Page 39 and 40:
ELISA for the presence of GWSS egg
- Page 41 and 42:
Project Leader: Thomas P. Freeman E
- Page 43 and 44:
Freeman, T. P., R. A. Leopold, D. R
- Page 45 and 46:
pathogen, when they move into viney
- Page 47 and 48:
A NOVEL IMMUNOLOGICAL APPROACH FOR
- Page 49 and 50:
1.6 GWSS Adults That Fed on Protein
- Page 51 and 52:
Hagler, J.R. & S.E. Naranjo. 2004.
- Page 53 and 54:
RESULTS: Oviposition Survey Wild gr
- Page 55 and 56:
Host specificity testing: No-choice
- Page 57 and 58:
currently employed morphological ch
- Page 59 and 60:
increase our present understanding
- Page 61 and 62:
BIOLOGY AND MORPHOMETRIC ANALYSIS O
- Page 63 and 64:
Table 1. Mean a developmental durat
- Page 65 and 66:
EFFECTS OF USING CONSTANT AND CYCLI
- Page 67 and 68:
REFERENCES Gautam, R. D. 1986. Effe
- Page 69 and 70:
PARASITISM OF THE GLASSY-WINGED SHA
- Page 71 and 72:
Table 1. Parasitism by G.ashmeadi o
- Page 73 and 74:
Project Leader: Robert F. Luck Dept
- Page 75 and 76:
A more interesting analysis using t
- Page 77 and 78:
MYCOPATHOGENS AND THEIR EXOTOXINS I
- Page 79 and 80:
POPULATION DYNAMICS AND INTERACTION
- Page 81 and 82:
No egg masses were recorded on olea
- Page 83 and 84:
EXPLORATION FOR FACULTATIVE ENDOSYM
- Page 85 and 86:
Although Baumannia and Wolbachia we
- Page 87 and 88:
EFFECTS OF SUBLETHAL DOSES OF IMIDA
- Page 89 and 90:
Table 2. Mortality and flight perfo
- Page 91 and 92:
A NOVEL METHOD TO INDUCE OVIPOSITIO
- Page 93 and 94:
REFERENCES Brodbeck, B. V., P. C. A
- Page 95 and 96:
Cohorts H. coagulata neonates were
- Page 97 and 98:
REFERENCES Blua, M. J. and D. J. W.
- Page 99 and 100:
Figure 2 shows the average numbers
- Page 101 and 102:
REPRODUCTIVE BIOLOGY AND PHYSIOLOGY
- Page 103 and 104:
REFERENCES Blua, M. J., Phillips, P
- Page 105 and 106:
- 164 -
- Page 107 and 108:
- 166 -
- Page 109 and 110:
RESULTS Some plant families had no
- Page 111 and 112:
Table 5. Winter, spring and summer
- Page 113 and 114:
16S rDNA is by far the most sequenc
- Page 115 and 116:
DNA MICROARRAY AND MUTATIONAL ANALY
- Page 117 and 118:
Inhibition of biofilm is BSA concen
- Page 119 and 120:
CULTURE-INDEPENDENT ANALYSIS OF END
- Page 121 and 122:
Borneman, J., M. Chrobak, G. Della
- Page 123 and 124:
P (CFU P OBJECTIVE 1. Determine the
- Page 125 and 126:
Purcell, AH and SR Saunders. 1999a.
- Page 127 and 128:
Figure 1: Southern blot of tolC::ap
- Page 129 and 130:
Project Leader: David Gilchrist Dep
- Page 131 and 132:
III. Production of transgenic plant
- Page 133 and 134:
RESULTS Construction of cDNA Librar
- Page 135 and 136:
CONCLUSIONS Genetic resistance and
- Page 137 and 138:
Mutagenesis of Xylella The EZ::TN T
- Page 139 and 140:
ISOLATION OF BACTERIOPHAGES SPECIFI
- Page 141 and 142:
Project Leader: Michele M. Igo Sect
- Page 143 and 144:
outer membrane fractions using two-
- Page 145 and 146:
1995; Purcell and Saunders, 1999).
- Page 147 and 148:
DEVELOPMENT OF SSR MARKERS FOR GENO
- Page 149 and 150:
Strain Name Host of Origin County o
- Page 151 and 152:
ROLE OF ATTACHMENT OF XYLELLA FASTI
- Page 153 and 154:
wild-type cells was not conclusive
- Page 155 and 156:
DETERMINATION OF GENES CONFERRING H
- Page 157 and 158:
S1 S2 S3 S4 Nb123456789bb123456789b
- Page 159 and 160:
MULTILOCUS SEQUENCE TYPING TO IDENT
- Page 161 and 162:
GENOME-WIDE IDENTIFICATION OF RAPID
- Page 163 and 164:
Americas and since most of the plan
- Page 165 and 166:
EFFECTS OF CHEMICAL MILIEU ON ATTAC
- Page 167 and 168:
CONCLUSIONS Our overall objective i
- Page 169 and 170:
RESULTS Objective 1. We conducted t
- Page 171 and 172:
Redak, R. A., Purcell, A. H., Lopes
- Page 173 and 174:
In parallel, an “activating trans
- Page 175 and 176:
PATTERNS OF XYLELLA FASTIDIOSA INFE
- Page 177 and 178:
% of vessels 100 80 60 40 20 Mugwor
- Page 179 and 180:
DOCUMENTATION AND CHARACTERIZATION
- Page 181 and 182:
Magnolia002 showed more identity (9
- Page 183 and 184:
PLASMID ADDICTION AS A NOVEL APPROA
- Page 185 and 186:
GENETIC VARIABILITY OF XYLELLA FAST
- Page 187 and 188:
- 246 -
- Page 189 and 190:
probing activities). In preliminary
- Page 191 and 192:
the slow release valve was opened a
- Page 193 and 194:
12. Hopkins DL (1977) Diseases caus
- Page 195 and 196:
The almost complete absence of info
- Page 197 and 198:
QUANTIFYING LANDSCAPE-SCALE MOVEMEN
- Page 199 and 200:
Table 1. The mean (±SD) ELISA read
- Page 201 and 202:
EPIDEMIOLOGICAL ASSESSMENTS OF PIER
- Page 203 and 204:
multiply to relatively high (easily
- Page 205 and 206:
SPATIAL DATABASE CREATION AND MAINT
- Page 207 and 208:
Project Leader: Thomas M. Perring D
- Page 209 and 210: Figure 2. Individual leaves from a
- Page 211 and 212: The state variables, process functi
- Page 213 and 214: DEVELOPMENT OF A FIELD SAMPLING PLA
- Page 215 and 216: Figure 1. Three main dispersion pat
- Page 217 and 218: - 276 -
- Page 219 and 220: - 278 -
- Page 221 and 222: OBJECTIVES 1. Track the movement of
- Page 223 and 224: REFERENCES 1. Beard, C.B., Cordon-R
- Page 225 and 226: cases, positive phloem samples were
- Page 227 and 228: EXPLOITING XYLELLA FASTIDIOSA PROTE
- Page 229 and 230: Figure 2. Polymer disk accumulation
- Page 231 and 232: CHARACTERIZATION OF NEONICOTINOIDS
- Page 233 and 234: EVALUATION OF RESISTANCE POTENTIAL
- Page 235 and 236: Project Leader: Doug Cook Dept. of
- Page 237 and 238: Based on the in silico analysis, de
- Page 239 and 240: CONTROL OF PIERCE’S DISEASE THROU
- Page 241 and 242: Figure 1. Oleander ‘White’ afte
- Page 243 and 244: RESULTS During the reporting period
- Page 245 and 246: DEVELOPMENT OF AN ARTIFICIAL DIET A
- Page 247 and 248: DESIGN OF CHIMERIC ANTI-MICROBIAL P
- Page 249 and 250: Neutrophil elastase Cecropin B Chim
- Page 251 and 252: and WTXb is very low (0.00-0.40%) a
- Page 253 and 254: 100 100 0.056 North America 100 0.0
- Page 255 and 256: GENETIC DIFFERENTIATION AMONG GEOGR
- Page 257 and 258: Table 1. Single-populations descrip
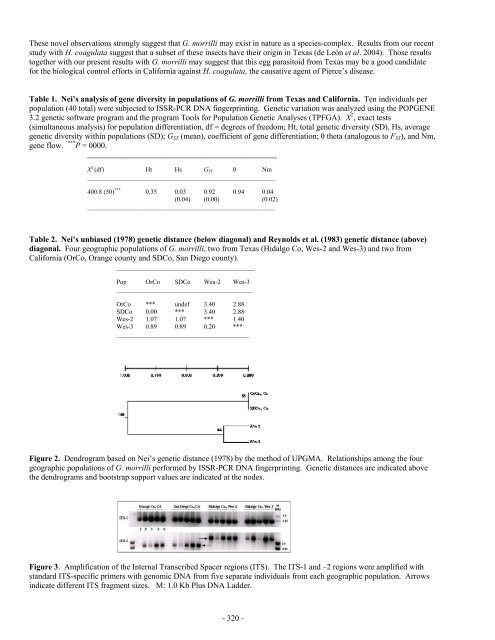
- Page 259: MOLECULAR DISTINCTION BETWEEN POPUL
- Page 263 and 264: SEQUENCE DIVERGENCE IN TWO MITOCHON
- Page 265 and 266: Table 3. Pairwise sequence distance
- Page 267 and 268: DEVELOPMENT OF MOLECULAR DIAGNOSTIC
- Page 269 and 270: A. B. Relative Density of SCAR Band
- Page 271 and 272: THE ALIMENTARY TRACK OF GLASSY-WING
- Page 273 and 274: We have dissected and identified al
- Page 275 and 276: REALIZED LIFETIME PARASITISM AND TH
- Page 277 and 278: REPRODUCTIVE AND DEVELOPMENTAL BIOL
- Page 279 and 280: Mean adult longevity (days) 25 20 1
- Page 281 and 282: the proposed exploratory work; thes
- Page 283 and 284: SEARCHING FOR AND COLLECTING EGG PA
- Page 285 and 286: REFERENCES Hoddle, M. S. and S. V.
- Page 287 and 288: some Gram(+) bacteria, but are inac
- Page 289 and 290: 7. Hultmark, D., et al., Insect Imm
- Page 291 and 292: Isolation of Fungal Pathogens Soil
- Page 293 and 294: IDENTIFICATION OF MECHANISMS MEDIAT
- Page 295 and 296: concentrations of 1.5 x 10 7 bacter
- Page 297 and 298: anchor it in the outer membrane (sh
- Page 299 and 300: SYMBIOTIC CONTROL OF PIERCE’S DIS
- Page 301 and 302: MANAGEMENT OF PIERCE’S DISEASE OF
- Page 303 and 304: pfF mutants are taken up by insects
- Page 305 and 306: Simpson, A. J. G., F. C. Reinach, P
- Page 307 and 308: Al-Wahaibi, A.K., Owen, and J. G. M
- Page 309 and 310: patterns differed among the lines,
- Page 311 and 312:
Punja, Z.K. 2001. Genetic engineeri
- Page 313 and 314:
mind, we conducted an additional st
- Page 315 and 316:
REFERENCES Toscano, N., Byrne, F.,
- Page 317 and 318:
RESULTS AND CONCLUSIONS The program
- Page 319 and 320:
COMPATIBILITY OF INSECTICIDES WITH
- Page 321 and 322:
More tests are in progress to addre