
You also want an ePaper? Increase the reach of your titles
YUMPU automatically turns print PDFs into web optimized ePapers that Google loves.
Characterizing the<br />
3. village land use system<br />
FOR MORE INFORMATION<br />
PLUP Toolbox 2:<br />
Socio-economic data and PLUP parameters<br />
IN A NUTSHELL<br />
Socio-economic data for land use<br />
planning are collected from the village<br />
household census, focus group discussions<br />
(as described in Section 2) and<br />
also from the PLUP Fiction role play. The<br />
average income values and labour force<br />
requirements for each land use type are<br />
elicited from the VLMC members. These<br />
data are first cross-checked with the<br />
household level data compiled for the<br />
whole village, and then the VLMC members<br />
agree together on the parameters<br />
that will be used all through the land use<br />
planning process. VLMC members fully<br />
understand that all the parameters come<br />
from them and that they participate in<br />
the entire calculation process. This elicitation<br />
process makes sure there is no<br />
‘black box effect’, especially during the<br />
calculation of the socio-economic and<br />
environmental impacts of land use plan<br />
scenarios tested on the virtual village<br />
landscape. Local people have therefore<br />
full ownership of the whole process.<br />
3.2<br />
Labour force requirement<br />
The labour force requirement is that required for all activities<br />
in the land use type over one year, i.e. the number of labour<br />
force units required per hectare for agriculture, NTFP collection<br />
and livestock. One labour unit corresponds to the labour of one<br />
adult person.<br />
= Number of labour units × % of land use type under each crop<br />
crops<br />
3.3<br />
Environmental indexes<br />
In addition to the socio-economic parameters, the two environmental<br />
indexes of biodiversity and carbon are discussed and<br />
included. The ideas of carbon and biodiversity are introduced<br />
to the villagers. For each land use, a coefficient ranging from<br />
1 to 4 is proposed based on forest inventories conducted in<br />
Viengkham District.<br />
First, the facilitators give VLMC members some examples of<br />
carbon and biodiversity values attributed to a few of the different<br />
land use types. Then, VLMC members are asked to guess<br />
the values for the other land uses. This helps to verify that the<br />
concepts are well understood. Villagers can easily rank the<br />
different land use types depending on their perceptions of the<br />
environmental values and so become aware of the potential<br />
impact of their decisions on the environment.<br />
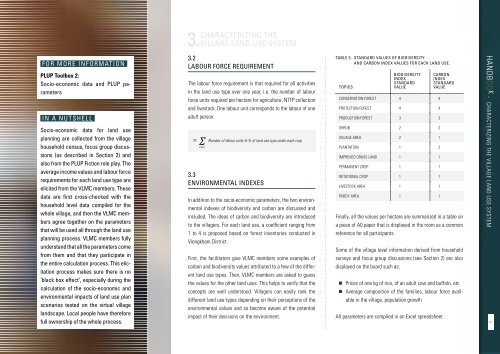
Table 3: Standard values of biodiversity<br />
and carbon index values for each land use.<br />
Topics<br />
Biodiversity<br />
index<br />
standard<br />
value<br />
Conservation forest 4 4<br />
Protection forest 4 4<br />
Production forest 3 3<br />
Shrub 2 2<br />
Village area 2 1<br />
Plantation 1 2<br />
Improved grass land 1 1<br />
Permanent crop 1 1<br />
Rotational Crop 1 1<br />
Livestock area 1 1<br />
Paddy area 1 1<br />
Carbon<br />
index<br />
standard<br />
value<br />
Finally, all the values per hectare are summarized in a table on<br />
a piece of A0 paper that is displayed in the room as a common<br />
reference for all participants.<br />
Some of the village level information derived from household<br />
surveys and focus group discussions (see Section 2) are also<br />
displayed on the board such as:<br />
• Prices of one kg of rice, of an adult cow and buffalo, etc.<br />
• Average composition of the families, labour force available<br />
in the village, population growth<br />
All parameters are compiled in an Excel spreadsheet .<br />
HANDBOO K - Characterizing the village land use system<br />
Participatory Land Use Planning (PLUP) HANDBOOK<br />
9