
You also want an ePaper? Increase the reach of your titles
YUMPU automatically turns print PDFs into web optimized ePapers that Google loves.
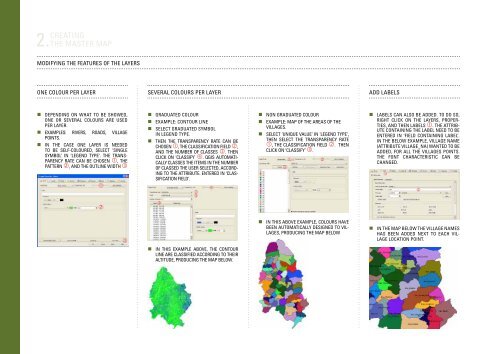
2. Creating<br />
the master map<br />
Modifying the features of the layers<br />
One colour per layer<br />
Several colours per layer<br />
Add labels<br />
• Depending on what to be showed,<br />
one or several colours are used<br />
per layer.<br />
• Examples: rivers, roads, village<br />
points.<br />
• In the case one layer is needed<br />
to be self-coloured, select ‘Single<br />
Symbol’ in ‘Legend Type’. The transparency<br />
rate can be chosen , the<br />
pattern , and the outline width <br />
• Graduated colour<br />
• Example: Contour line<br />
• Select Graduated Symbol<br />
in Legend Type.<br />
• Then the transparency rate can be<br />
chosen , the classification field ,<br />
and the number of classes . Then<br />
click on ‘Classify’ . QGIS automatically<br />
classes the items in the number<br />
of classed the user selected, according<br />
to the attribute. entered in ‘Classification<br />
field’.<br />
• Non graduated colour<br />
• Example: Map of the areas of the<br />
villages.<br />
• Select ‘Unique value’ in ‘Legend Type’,<br />
then select the transparency rate<br />
, the classification field . Then<br />
click on ‘Classify’ .<br />
• Labels can also be added. To do so,<br />
right click on the layers, Properties,<br />
and then Labels . The attribute<br />
containing the label need to be<br />
entered in ‘Field containing label’.<br />
In the below example, village name<br />
(attribute village_na) wanted to be<br />
added, for all the villages points.<br />
The font characteristic can be<br />
changed.<br />
• In this above example, colours have<br />
been automatically designed to villages,<br />
producing the map below<br />
• In the map BELOW the village names<br />
has been added next to each village<br />
location point.<br />
• In this example above, the contour<br />
line are classified according to their<br />
altitude, producing the map below.