
Create successful ePaper yourself
Turn your PDF publications into a flip-book with our unique Google optimized e-Paper software.
2. Producing a<br />
monograph<br />
8. Add a photograph of a village plantation<br />
or animals.<br />
9. Add the table from the Mo_p3 sheet<br />
of the ‘village name’_diagnosis_<br />
data Excel file which details the<br />
number of the various animals<br />
10. Add the “Living livestock capital<br />
per household type” chart from the<br />
Mo_p3 sheet of the Excel file ‘village<br />
name’_diagnosis_data<br />
11. Add the chart “Evolution of the<br />
livestock herd” from the sheet Mo_<br />
p3 of the Excel file ‘village name’_diagnosis_data<br />
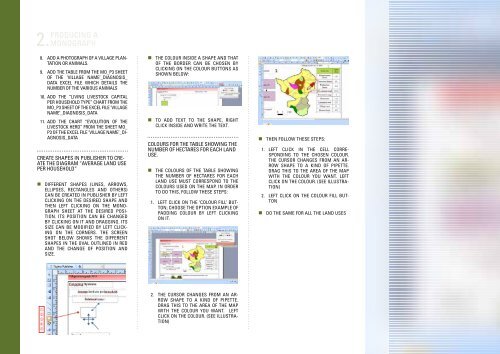
Create shapes in Publisher to create<br />
the diagram “average land use<br />
per household”<br />
• Different shapes (lines, arrows,<br />
ellipses, rectangles and others)<br />
can be created in Publisher by left<br />
clicking on the desired shape and<br />
then left clicking on the monograph<br />
sheet at the desired position.<br />
Its position can be changed<br />
by clicking on it and dragging. Its<br />
size can be modified by left clicking<br />
on the corners. The screen<br />
shot below shows the different<br />
shapes in the oval outlined in red<br />
and the change of position and<br />
size.<br />
• The colour inside a shape and that<br />
of the border can be chosen by<br />
clicking on the Colour buttons as<br />
shown below:<br />
• To add text to the shape, right<br />
click inside and write the text.<br />
Colours for the table showing the<br />
number of hectares for each land<br />
use.<br />
• The colours of the table showing<br />
the number of hectares for each<br />
land use must correspond to the<br />
colours used on the map. In order<br />
to do this, follow these steps:<br />
1. Left click on the ‘colour fill’ button;<br />
choose the option example of<br />
padding colour by left clicking<br />
on it.<br />
• Then follow these steps:<br />
1. Left click in the cell corresponding<br />
to the chosen colour.<br />
The cursor changes from an arrow<br />
shape to a kind of pipette.<br />
Drag this to the area of the map<br />
with the colour you want. Left<br />
click on the colour. (See illustration)<br />
2. Left click on the colour fill button<br />
• Do the same for all the land uses<br />
2. The cursor changes from an arrow<br />
shape to a kind of pipette.<br />
Drag this to the area of the map<br />
with the colour you want. Left<br />
click on the colour. (See illustration)