
Create successful ePaper yourself
Turn your PDF publications into a flip-book with our unique Google optimized e-Paper software.
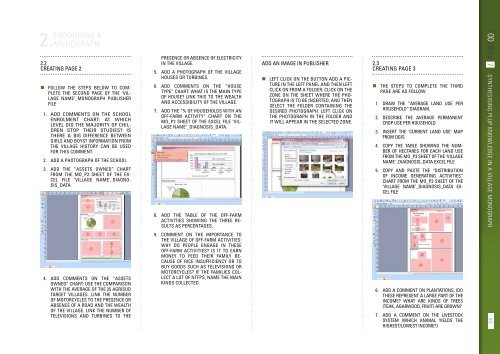
2. Producing a<br />
monograph<br />
2.2<br />
Creating page 2<br />
• Follow the steps below to complete<br />
the second page of the ‘village<br />
name’_monograph Publisher<br />
file<br />
1. Add comments on the school<br />
enrolment chart: At which<br />
level did the majority of children<br />
stop their studies? Is<br />
there a big difference between<br />
girls and boys? Information from<br />
the village history can be used<br />
for this comment.<br />
2. Add a photograph of the school<br />
3. Add the “assets owned” chart<br />
from the Mo_p2 sheet of the Excel<br />
file ‘village name’_diagnosis_data<br />
presence or absence of electricity<br />
in the village.<br />
5. Add a photograph of the village<br />
houses or turbines.<br />
6. Add comments on the “house<br />
type” chart: What is the main type<br />
of house? Link this to the wealth<br />
and accessibility of the village.<br />
7. Add the “% of households with an<br />
off-farm activity” chart on the<br />
Mo_p2 sheet of the Excel file ‘village<br />
name’_diagnosis_data.<br />
8. Add the table of the off-farm<br />
activities showing the three results<br />
as percentages.<br />
Add an image in Publisher<br />
• Left click on the button Add a picture<br />
in the left panel and then left<br />
click on From a folder. Click on the<br />
zone on the sheet where the photograph<br />
is to be inserted, and then<br />
select the folder containing the<br />
desired photograph. Left click on<br />
the photograph in the folder and<br />
it will appear in the selected zone.<br />
2.3<br />
Creating page 3<br />
• The steps to complete the third<br />
page are as follow:<br />
1. Draw the “average land use per<br />
household” diagram.<br />
2. Describe the average permanent<br />
crop use per household<br />
3. Insert the ‘current land use’ map<br />
from QGIS<br />
4. Copy the table showing the number<br />
of hectares for each land use<br />
from the Mo_p3 sheet of the ‘village<br />
name’_diagnosis_data Excel file<br />
5. Copy and paste the “distribution<br />
of income generating activities”<br />
chart from the Mo_p3 sheet of the<br />
‘village name’_diagnosis_data Excel<br />
file<br />
TOOLBOX 7 Synthesising PLUP knowledge in a village monograph<br />
4. Add comments on the “assets<br />
owned” chart: Use the comparison<br />
with the average of the 25 AgriSud<br />
target villages. Link the number<br />
of motorcycles to the presence or<br />
absence of a road and the wealth<br />
of the village. Link the number of<br />
televisions and turbines to the<br />
9. Comment on the importance to<br />
the village of off-farm activities:<br />
Why do people engage in these<br />
off-farm activities? Is it to earn<br />
money to feed their family because<br />
of rice insufficiency or to<br />
buy goods such as televisions or<br />
motorcycles? If the families collect<br />
a lot of NTFPs, name the main<br />
kinds collected.<br />
6. Add a comment on plantations. (Do<br />
these represent a large part of the<br />
income? What are kinds of trees<br />
(teak, agarwood, fruit) are grown?<br />
7. Add a comment on the livestock<br />
system (Which animal yields the<br />
highest/lowest income?)<br />
93