Waterway Panorama - Antaq
Waterway Panorama - Antaq
Waterway Panorama - Antaq

Create successful ePaper yourself
Turn your PDF publications into a flip-book with our unique Google optimized e-Paper software.
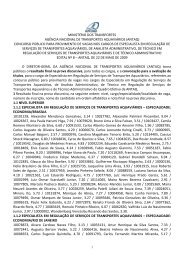
600.000.000<br />
500.000.000<br />
400.000.000<br />
300.000.000<br />
200.000.000<br />
100.000.000<br />
0 tolenadas<br />
2004 2005 2006 2007 2008<br />
l Imports l Exports l Total<br />
Containers<br />
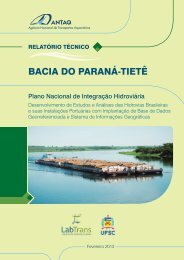
The containerization index refers to the percentage<br />
of goods transported in containers,<br />
in relation to the total general cargo. Despite<br />
the reduction rate of 1.17%, observed in<br />
2008 for 2007, there was a greater increase in<br />
absolute numbers of cargo handled in containers<br />
(5,202,847 tonnes) than general cargo loose<br />
(4,616,299 tonnes). In 2008 there were<br />
112,501,852 tonnes of general cargo, with<br />
73,248,231 tonnes in containers and<br />
39,253,621 tonnes as loose cargo. In the previous<br />
year, they were 102,682,706 tonnes,<br />
68,045,384 tonnes, and 34,637,322 tonnes.<br />
The series shows the trend of logistics in the increasing<br />
use of containers, whether for transportation<br />
of food products or industrial products.<br />
In some places, such as the port of Rio Grande,<br />
surpluses of bulk ores and soybeans were transported<br />
by this type of packaging.<br />
68,00%<br />
66,00%<br />
66,27%<br />
65,10%<br />
64,00%<br />
62,36%<br />
62,00%<br />
60,00%<br />
57,38%<br />
59,70%<br />
59,23%<br />
58,00%<br />
56,00%<br />
54,00%<br />
52,00%<br />
2002 2003 2004 2005 2006 2007 2008 2009<br />
l Containerization index<br />
11